
📣 Create Blog for Traders!
Stop Watching news - Start Making it.
START


Relative Strength Moving Averages

***
In modern markets, performance is relative, not absolute.
Key question:
Is this asset outperforming alternatives?
Relative Strength (RS) answers this by comparing an asset to a benchmark.
***
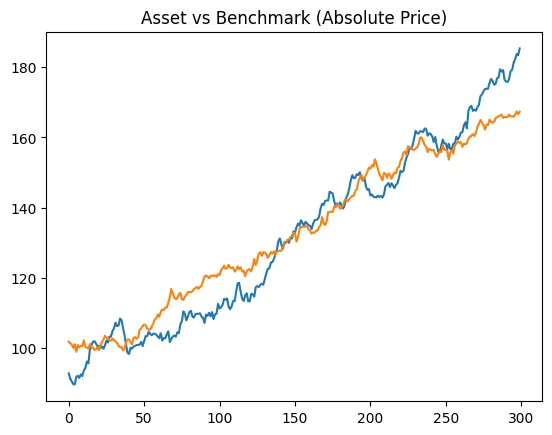
Both may rise — yet capital can still rotate away from one of them.
***
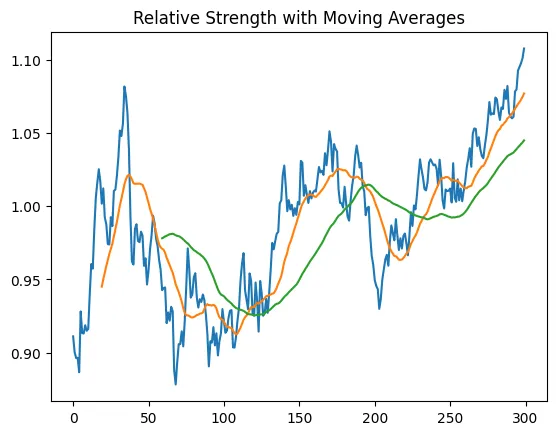
Relative Strength ratio:
RS = Asset / Benchmark
Applying moving averages:
- smooths noise
- reveals persistence
- defines leadership regimes
***
Interpretation:
- RS above MA → outperformance
- Fast MA > Slow MA → sustained leadership
***
RSMA reflects capital allocation, not prediction.
Leadership trends persist until flows change.
***
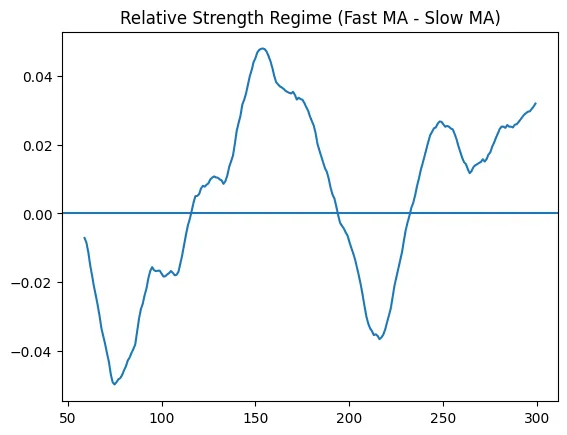
- Above zero → outperformance regime
- Below zero → underperformance regime
This acts as a bias filter, not an entry trigger.
***
ToolMeasuresRSIInternal momentumRSMARelative performance
The strongest trends occur when:
- price trend is up
- RSI holds bullish range
- RSMA confirms leadership
***
- Equities: sector and stock selection
- Crypto: ALT / BTC rotation
- Macro: risk-on vs defensive shifts
***
- RSI defines momentum health
- RSMA defines capital leadership
Together, they form a modern momentum framework suited for ETF-driven, algorithmic markets.
Alpha no longer comes from prediction — it comes from alignment with flows.
Comments