
📣 Create Blog for Traders!
Stop Watching news - Start Making it.
START


Bitcoin Below $70,000: A Strategic Entry Point or a Capitulation Trap? (February 2026)
The recent dip below the psychological $70,000 mark has created a stark divergence between "Old Guard" holders and the new wave of institutional allocators. While retail sentiment has plunged into "Extreme Fear," industry leaders suggest this correction is a necessary reset before the next structural leg up.
Risk Disclosure: Cryptocurrency trading involves significant capital risk. Forecasts of 70-80% drawdowns are statistical possibilities, not certainties. Never trade with funds required for essential living expenses. 80% of retail traders lose money over a 12-month period.
Hunter Horsley, CEO of Bitwise, notes that institutional players aren't panicking; they are buying. For many large-scale funds that missed the $100k breakout in 2025, sub-$75k levels represent "prices they thought they had missed forever."
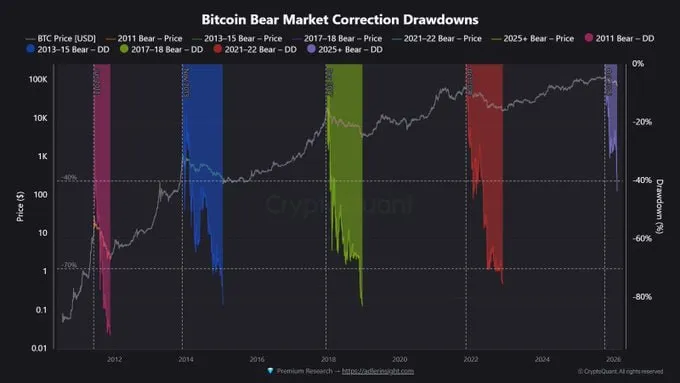
Featured Snippet Answer: As of February 2026, Bitcoin's drop below $70,000 is viewed by Bitwise as a massive institutional opportunity rather than a technical failure. While CryptoQuant warns of a potential deeper slide toward $56,000–$60,000 if liquidity remains thin, technical metrics like the Supply in Profit/Loss ratio suggest that the market is in the final stages of a healthy deleveraging phase, similar to the 2018 and 2022 bottoms.
While Bitwise is bullish, CryptoQuant analysts remain cautious. Their 2026 roadmap highlights a risk of a 70-80% drawdown from the $126k ATH, which would place a potential macro bottom near $56,000.
- The Key Risk: It’s not just the price; it’s the time to capitulation.
- Institutional Shift: In 2025, ETFs were net buyers of 46,000 BTC. In early 2026, they turned into net sellers of 10,600 BTC, creating a demand gap that is currently being tested.
Renowned analyst Michaël van de Poppe points to the Supply in Profit vs. Supply in Loss metric as a sign of an impending reversal. Historically, when the gap between profitable and losing addresses narrows to current levels (around 11M BTC in profit vs 9M BTC in loss), it aligns with the macro bottoms of 2018 and 2022.
Experience Note: "During the 2022 crash, I watched this metric hit a 'convergence' point just days before the reversal," says a senior analyst at MN Trading. "In February 2026, we are seeing the same exhaustion. The sellers are simply running out of 'cheap' coins to dump."
- Bitwise Research: Q1 2026 Market Outlook: https://www.bitwiseinvestments.com/research — Hunter Horsley’s full thesis.
- CryptoQuant: Bear Market Phase Report (Feb 2026): https://cryptoquant.com/analytics/dashboard/ — Detailed analysis of the $56k floor.
- Glassnode: Supply in Profit/Loss Convergence: https://studio.glassnode.com/charts/supply-profit-loss — Technical data for the Van de Poppe signal.
- 21Shares: Institutional Sentiment Data February 2026: https://www.21shares.com/research/ — Analysis of the spot buy/sell ratios.
Q: Why does Hunter Horsley think the 4-year cycle is broken? A: He argues that the introduction of Spot ETFs has changed the market structure, making price action more dependent on institutional demand waves than the halving event.
Q: What is the "Supply in Profit" metric? A: It measures the percentage of all circulating BTC that was last moved when the price was lower than it is today. When this number drops significantly, it usually means the "weak hands" have already sold.
Q: Should I wait for $56,000 to buy? A: While CryptoQuant projects a potential dip to $56k, many institutions use DCA (Dollar Cost Averaging) between $60k and $75k to avoid missing the eventual Q1 2026 recovery.