
📣 Create Blog for Traders!
Stop Watching news - Start Making it.
START


Nikkei225 Rebounds From Correction as Bulls Test Key Resistance
In this comprehensive analysis, Ultima Markets presents a detailed technical outlook for the Nikkei225 as of March 11, 2026.
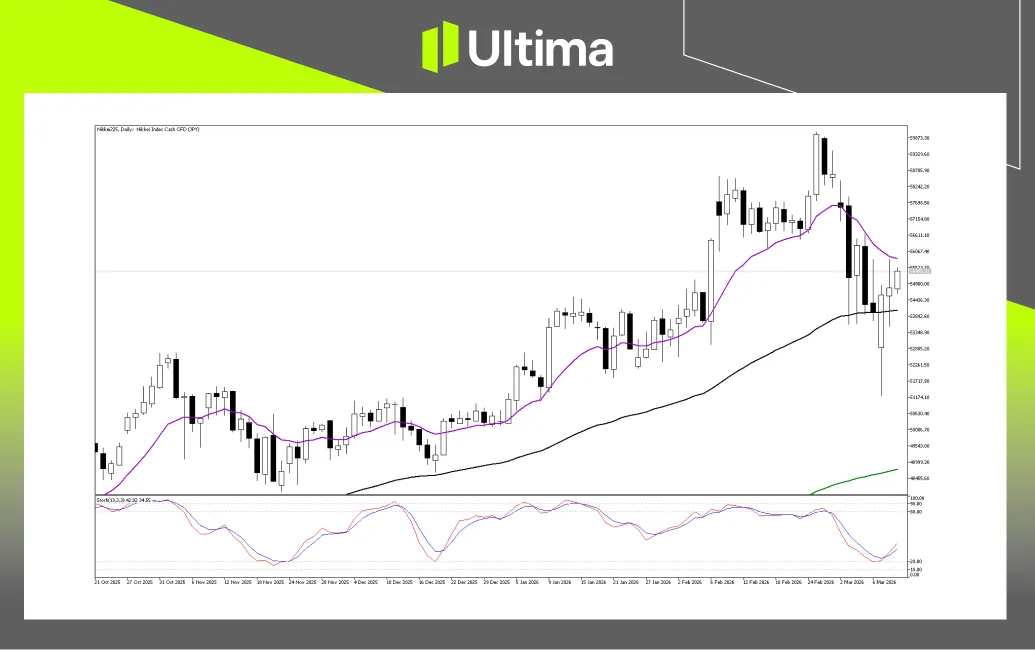
The broader trend for the Nikkei225 remains upward, supported by a series of higher highs and higher lows formed between late October and February. However, the index recently experienced a sharp correction after reaching levels close to 60,000.
Price has since begun to rebound, finding support near an intermediate-term moving average. Early signs of renewed upward momentum are emerging, suggesting a cautiously bullish outlook as long as this support zone continues to hold.
Key Levels
Immediate support is located around 53,800–54,400, aligning with the intermediate black moving average and helping to maintain the medium-term bullish structure. A breakdown below this area would shift attention toward the 51,700–52,200 zone, where previous resistance had turned into support.
On the upside, the first resistance lies near 56,000–56,600, where the fast purple moving average currently sits. Beyond that, additional resistance is found around 57,600–58,200, corresponding to the selling pressure seen during the late-February correction. Major resistance remains near the all-time high zone of 59,800–60,000.
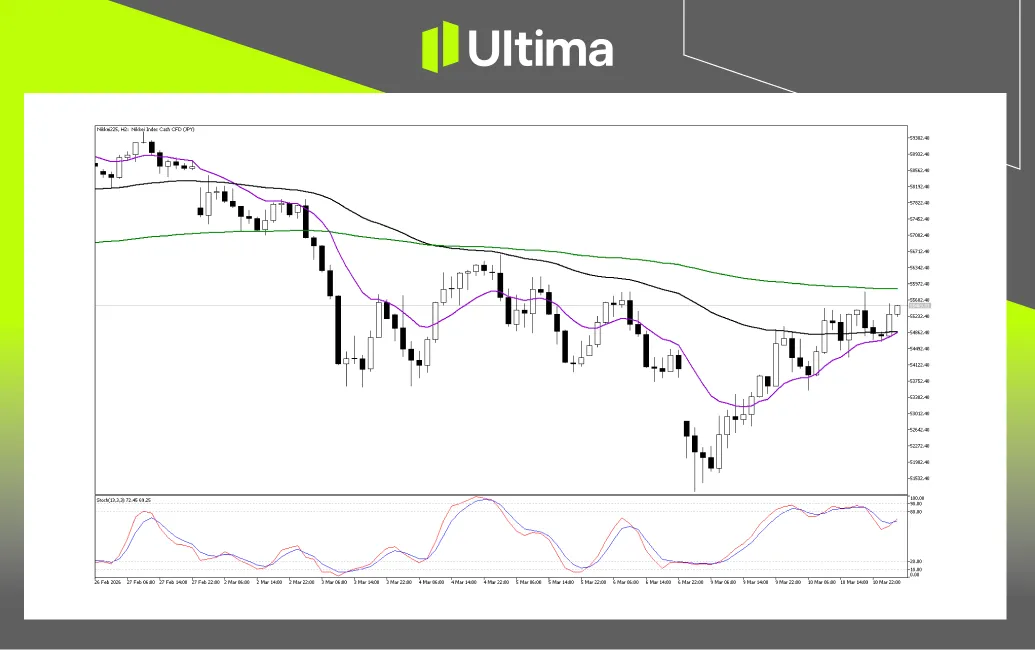
On the H2 timeframe, the index has transitioned from a simple rebound into a more structured short-term uptrend. However, the market is now approaching an important resistance region where it must overcome longer-term overhead pressure to confirm whether this recovery represents a genuine trend reversal or merely an oversold bounce.
Breakout Scenarios
The primary bullish scenario requires the index to break through the 55,800–56,000 region and maintain a strong H2 candle close above the green moving average around 56,400. A breakout above this slower moving average would suggest that the recovery is gaining strength and could trigger further buying interest, potentially pushing prices toward 57,000 and beyond. The recent bullish crossover in the Stochastic indicator supports the possibility of such an upward move.
On the downside, a key warning signal would emerge if the price closes decisively below 54,800 on the H2 chart. Such a move would break the current pattern of higher lows, indicating that the rebound may be losing momentum. In that scenario, the index could retrace toward 53,700, testing the strength of buyers who previously stepped in during the V-shaped recovery.
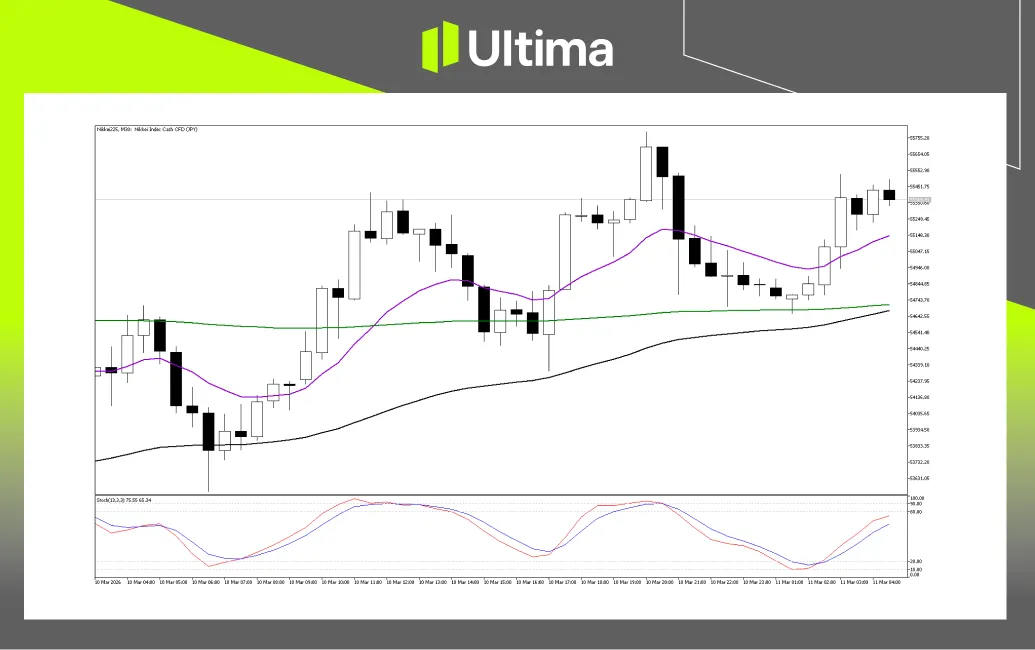
In the near term, momentum remains positive following the strong rebound from recent lows. However, the index is approaching a resistance zone, and momentum indicators suggest that the rally is becoming somewhat stretched. This means that either a breakout will need to occur soon, or the market may undergo a short-term consolidation or pullback.
Bullish Continuation Breakout
For the intraday rally to extend further, buyers must successfully push price above the current consolidation area. A decisive M30 candle close above 55,450 would signal renewed buying pressure and could trigger a quick move toward the 55,700–55,750 region, which represents the recent session highs. If momentum remains strong, a breakout above that level may open the path toward the psychological 56,000 mark.
Bearish Mean-Reversion Scenario
As the Stochastic oscillator approaches overbought territory, the market may temporarily lose upward momentum. A potential bearish scenario would develop if price repeatedly fails to break through the 55,450–55,500 zone and begins forming lower highs. A break below the fast purple moving average near 55,100 would confirm weakening momentum, potentially leading to a pullback toward the 54,700 support area, where the green moving average sits. Such a move would represent a typical corrective retracement within a broader uptrend.
Navigating and trading the forex markets requires clarity, discipline, and access to reliable insights. Ultima Markets is committed to providing data-driven analysis to support informed trading decisions.
Join Ultima Markets today and stay connected with us by following us on social media for the latest news, events, and product updates. Visit UM Academy and access unlimited educational trading resources to help you master the markets.
—–
Trading leveraged derivative products carries a high level of risk and may not be suitable for all investors. Leverage can magnify both gains and losses, potentially resulting in rapid and substantial capital loss. Before trading, carefully assess your investment objectives, level of experience, and risk tolerance. If you are uncertain, seek advice from a licensed financial adviser. Leveraged products are not intended for inexperienced investors who do not fully understand the risks or who are unable to bear the possibility of significant losses.
Comments, news, research, analysis, price, and all information contained in the article only serve as general information for readers and do not suggest any advice. Ultima Markets has taken reasonable measures to provide up-to-date information, but cannot guarantee accuracy, and may modify without notice. Ultima Markets will not be responsible for any loss incurred due to the application of the information provided.