
📣 Create Blog for Traders!
Stop Watching news - Start Making it.
START


Euro Gas Goes Nuclear: A 40% Spike I Almost Missed
While everyone was staring at Bitcoin's sideways chop, Natural Gas handed out one of the best setups of the year. Here's how to catch the next one.
I'm going to be honest. I spent most of Monday and Tuesday getting chopped to pieces by BTC. A fakeout above $67k, a nuke below $66k... it was messy. I was so zeroed-in on crypto, trying to force a trade, that I completely ignored my broader watchlist. Then I pull up my futures screen and see it: Dutch TTF Natural Gas (NG1!) ripping over 40% in a single session. The strongest daily gain since the war broke out in 2022. And I missed the initial entry. It's a classic rookie mistake, and a painful reminder of my number one rule: I go where the setup is. The market doesn't care about my favorite asset; it rewards those who show up to the party.
My phone immediately blew up with news alerts. Strikes in Australia, supply fears, blah blah blah. By the time the headlines hit, the move was already well underway. This is the edge we have as pure price action traders. While macro guys like Alex Volkov are reading reports to figure out the 'why', the chart had already given us the 'what' and the 'when'. This massive spike didn't come out of nowhere. It came after weeks of grinding consolidation and compressing volatility. The chart was a coiled spring, and all you had to do was be there when it snapped. This is a perfect lesson in volume analysis trading and why it's the only forward-looking indicator that matters.
So how do you catch a move like this without getting run over? It’s not about guessing. It's about having a plan for when volatility returns. This is one of the best day trading setups period, because it has a clear invalidation level and explosive potential.
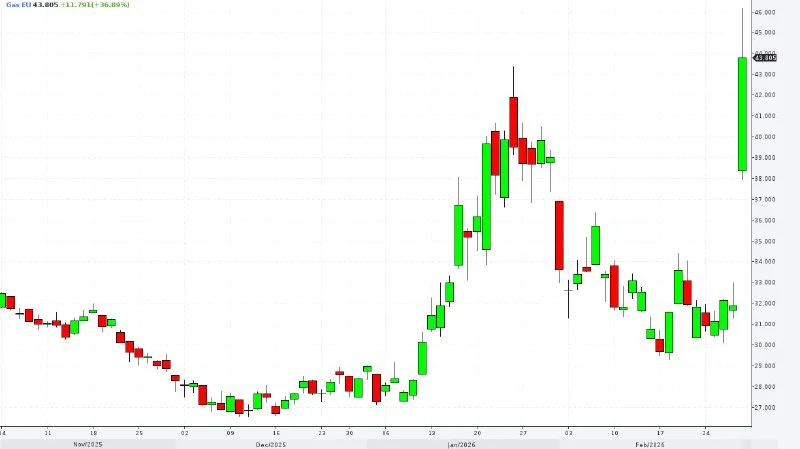
For weeks, NG1! was trading in a painfully tight range, mostly between €29 and €34. The daily candles got smaller. Volume dried up. This is the boring part where most people lose interest. For me, this is when the asset goes to the top of my watchlist. I draw my lines, set my alerts, and wait. The longer the base, the bigger the breakout. It's one of the first things you learn in technical analysis for beginners, but one of the hardest to have patience for.
A breakout without volume is a fakeout waiting to happen. I needed to see a 4H or Daily candle close outside the range on volume that was at least double the 20-period average. When NG1! broke above €35, the volume bar on my screen was a skyscraper. It was the 'all-clear' signal. That's not institutions taking a small position; that's panic and FOMO all hitting the buy button at once. It’s the footprint of the big money.
- Consolidation Zone: €29.50 - €34.00
- Breakout Level: A firm close above €35.00
- Volume Signal: 4H volume > 2x 20-period moving average
- My Entry Target: Retest of the breakout, around €35.50 for a long.
This exact pattern works on any asset that moves. It doesn't matter if it's a small-cap stock Sarah Chen is covering or a major forex pair. Price behavior is universal. The key is separating the high-probability signals from the noise.
Since I missed the initial entry, my biggest enemy became my own psychology. The urge to market-buy the top at €41 was immense. Pure FOMO. I've blown up two accounts in my career by doing exactly that. You feel like you're missing the move of a lifetime, so you jump in with a huge position and no plan. Then you get hit with a nasty pullback, you get stopped out, and then you revenge trade to 'make it back'. It's a vicious cycle. My journal is filled with notes on this exact mistake. I had to literally get up from my desk, walk away, and wait for my level—the retest of the breakout. If it never comes, I never enter. The setup comes first, my P&L comes second.
Don't chase the news, chase the setup. The chart tells you everything you need to know before the headlines do.
So, my action for you is this: Pull up the NG1! chart on TradingView on the daily timeframe. Go back a few months. Can you spot the consolidation? Can you see the volume drying up before the explosion? This wasn't magic; it was a textbook setup hiding in plain sight. What's the biggest gainer you missed because you were too focused on one market, and what did you learn from it?