
📣 Create Blog for Traders!
Stop Watching news - Start Making it.
START


Natural Gas Is Ripping. Here's My Price Action Playbook.
Forget the headlines. The charts were screaming this move was coming for days. I'm breaking down the key levels and the exact setup I'm stalking now.
I woke up this morning, grabbed my coffee, and saw the numbers flashing red... or rather, bright green. Gas in Europe up +15%. Gas in Britain, another +15%. Even the US contract, NG1!, was popping +4%. The news bots were calling it 'Gas Armageddon.' And my first thought wasn't about geopolitics or supply chains. It was: 'Of course.' Because if you were watching the tape, the chart was practically yelling at you that a move was coming. This is a classic case of price action leading the news, and it's where we traders make our money.
Let's ignore Europe for a second and focus on what I trade most: the US futures contract, NG1! on TradingView. For weeks, it was a choppy mess. Just absolute garbage price action designed to chew up accounts. But then, something beautiful happened. We formed a clear base of support around the $2.85 level. It tested it once, twice, three times. Each time, buyers stepped in. This is pure accumulation. The big money is building their bags.
The signal for me was the daily candle from two days ago. It was a massive bullish engulfing candle right off that support zone. If you want to know how to read candlestick patterns, this is exhibit A. It tells you the entire sentiment has shifted in a single session. The sellers tried to push it down, and the buyers not only defended the level but completely overwhelmed them, closing near the high. That was the 'get ready' signal. The pop this morning above the $3.00 psychological level was the confirmation.
Now, the moves in Europe are on another planet. A +15% daily move is insane, and it's a paradise for volatility traders. My friend Alex Volkov is probably digging into the Russian pipeline data and storage reports to explain the 'why' behind this. Me? I just see a chart that went vertical. It's a classic short squeeze. Anyone betting against it got their face ripped off. It's a painful lesson lots of traders learn the hard way.
This kind of environment is where you find some of the best day trading setups imaginable, but you can't just jump in blindly. Chasing a +15% green candle is how you end up becoming the exit liquidity for the smart money. You have to have a plan. You have to wait for your setup. For me, that's the breakout and retest. Always.
I didn't catch the initial explosion this morning. I was still marking up my levels. And that's okay. The fear of missing out (FOMO) is a bigger account killer than picking the wrong direction. Here's the plan I've got on my whiteboard right now for NG1!:
- The Level: I'm watching the prior resistance area around $2.98-$3.00. This is the lid we just blew off.
- The Entry: I want to see price pull back to this zone and hold. I'll be watching the 15-minute chart for a hammer or a bullish engulfing candle to signal buyers are defending the new support.
- The Stop: My stop-loss will go just below the low of that confirmation candle, probably around $2.94.
- The Target: First target is the recent high around $3.10. My final target would be the next major resistance level from last month at $3.25.
This gives me a risk/reward ratio of over 3:1. It's a high-probability trade based on simple, repeatable market structure. As Marcus Cole always says, you need confluence. Here, we'd have horizontal support (the old resistance), potentially a moving average catching up, and a candlestick confirmation. That's a textbook A+ setup in my trading journal. It's a simple chart patterns breakdown, but simple is what works.
No setup is guaranteed. Trading is a game of probabilities, not certainties. This trade gets invalidated for me if we slice right back through $2.95 like it's not even there. If that happens, this whole move was a giant fakeout—a bull trap to lure in FOMO buyers before nuking the price back to the lows. It happens.
The biggest risk, for me, is psychological. If I take the trade and get stopped out by a nasty wick, the urge to jump right back in and 'make it back' is huge. That's revenge trading, my personal demon. I've blown up two accounts that way. Sticking to the plan, even after a loss, is the only thing that separates professional traders from gamblers.
News tells you what just happened. The chart tells you what's about to happen. Trust the chart.
So while the talking heads on TV debate supply figures, I'll be watching my levels. The price tells the only story that matters. This volatility is a gift if you know how to trade it. So, is this spike the beginning of a brutal winter for consumers and a bull run for commodity traders, or is it just a headline-driven flash in the pan before the bears take back control?
Read More on TradersWeek:→ Aluminum's Breakout: My Price Action Trading Strategy→ Geopolitical Noise: How I'm Trading Volatility on Iran News→ Geopolitical Noise vs. Price Action: My Trading Playbook
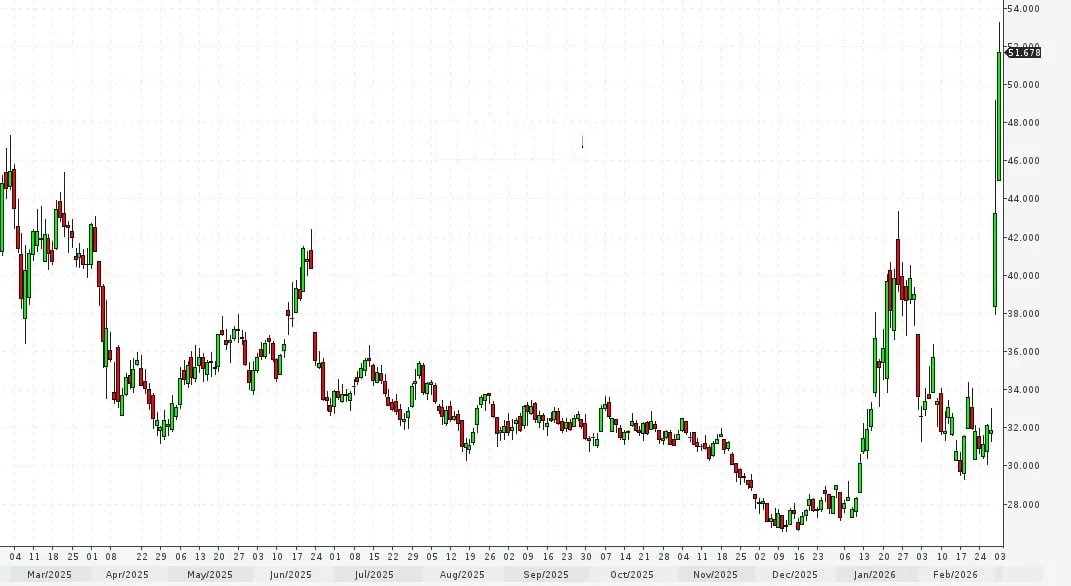
UNG chart · Powered by Finviz
Trading ToolsStock Screener · Futures · Try FINVIZ Elite Free