
📣 Create Blog for Traders!
Stop Watching news - Start Making it.
START


Recession Bets Soar, But The Chart Tells a Different Story
Kalshi markets are screaming recession, but I'm fading the news. Here's my head-to-head on why price action beats headlines every single time.
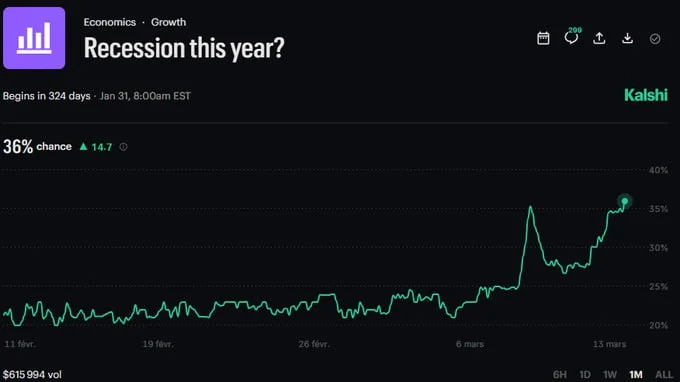
So, bets on a US recession are maxed out on Kalshi this week. Does that mean you should nuke your longs and buy puts? Absolutely not. For me, that's just noise. The real signal isn't on a prediction market; it's right there on the price chart. This is the ultimate battle for a trader: do you trade the news, or do you trade what's actually happening with price and volume?
Headlines create emotion. Charts create setups. I trade the setup, not the emotion.
Let's be real. By the time you read a headline that a recession is 'imminent,' the smart money has been positioning for weeks, if not months. Trading the news is a lagging indicator. It’s a game of chasing ghosts. You see the news, you panic-sell, and you get bought up by institutions at a discount. Or you FOMO-buy a rumor and get dumped on when the news is a dud.
I've been there. I blew up my first account trying to trade Non-Farm Payrolls. It's pure chaos. The price wicks 2% in both directions in 60 seconds. You get stopped out for a loss no matter which way you bet. My friend Alex Volkov loves digging into this macro stuff, and he's good at it, but for a day trader, it's a recipe for getting chopped to pieces.
Now, let's talk about what's actually working. Price. It's the only truth. It's the final output of every news event, every algorithm, every fear, and every greedy impulse in the market. Why try to interpret the news when you can just read the result?
Take Bitcoin this morning. While Kalshi traders are betting on doom, BTC is sitting pretty above $73,500. The chart gave us a textbook breakout and retest of the $70,000 level earlier this week. The volume on the breakout was solid, and the retest came on declining volume. That's a classic sign that sellers are exhausted. That's a trade I can define my risk on. My stop is below the retest low. Simple. Clean.
On the SOL/USD 4-hour chart last week, price wicked down to make a new low around $85, but the RSI(14) printed a higher low. That's a bullish divergence. It’s the market tipping its hand, showing you that downside momentum is fading even as price makes one last dip. I took a long on the confirmation candle and rode it back up to $92. No news report told me to do that. The chart did.
- Signal Timing: News is almost always late. Price action is real-time.
- Clarity: News is subjective and open to interpretation. A broken support level is an objective fact.
- Risk Management: How do you set a stop loss on a headline? You can't. On a chart, your invalidation level is clear as day.
- Psychology: News creates FOMO and fear. Charts, once you learn to read them, create plans and if/then scenarios.
This is why the core of my day trading risk management rules is to always define my exit based on a price level, not a narrative. If the story changes but the level holds, I stay in the trade. If the level breaks but the story sounds bullish, I'm out. No questions asked. This has saved me from more bad trades than I can count, especially when I'm tempted to revenge trade after a dumb loss.
Forget the recession talk. Heading into Friday's close, I'm watching key levels. While Marcus Cole is tracking the new ETHB fund flows, I'm focused on the ETH/USD chart itself. The level to watch is $2,250. A clean break and hold above there on the daily, and I think we see a fast move to $2,400. My invalidation is a close back below $2,100.
My verdict is clear: trading the chart is superior. The Kalshi data is an interesting footnote, but it's not a trading signal. It's a sentiment poll. And the market loves to punish popular sentiment. Let them bet on recession; I'll bet on the trend until the price tells me it's over.
So when you see a screaming headline that directly contradicts a clean technical setup on your screen, which one are you going to trust with your hard-earned capital?