
📣 Create Blog for Traders!
Stop Watching news - Start Making it.
START


Treasuries Volatility: My Playbook for 'Epic Rage' in March 2026
US Treasury volatility is at a one-year high. Don't fear it; trade it! My analysis shows key levels and setups for the week ahead.
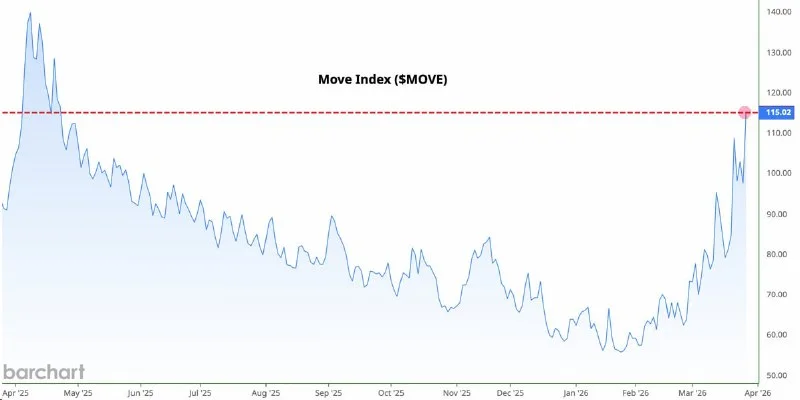
So here's what nobody's talking about: everyone's focused on the 'Epic Rage' operation and the macro implications for US Treasuries, but what I see is pure opportunity. Volatility in Treasuries hitting a one-year high? That's not FUD, that's fuel for a day trader like me. This isn't about some fancy economic model; it's about how to read candlestick patterns when the market is screaming for direction. I've blown up two accounts learning to trade this kind of chop, so trust me, I know a setup when I see one.
What happened last week? The bond market just got absolutely nuked. We saw the ZT (2-year Treasury futures) drop from 101.45 down to 101.00 by mid-week, then a violent bounce back to 101.20 before heading into Friday's close. That kind of back-and-forth action is exactly what you want for a Sarah Chen might be looking at the yield curve inversions, but I'm looking at the chart of TLT (iShares 20+ Year Treasury Bond ETF). It's been hammered, printing lower lows and lower highs since the start of the month, but volume on the down moves is starting to taper off.
Meanwhile, crypto decided to take a breather. Bitcoin (BTC) is down 3.8% to $66,670, Ethereum (ETH) is at $1,989.97, and Solana (SOL) got chopped down to $83.37. Historically, when Treasuries get volatile like this, risk assets can get squeezed. But what if this Treasury volatility is creating a temporary flight to safety *before* a bigger rotation back into risk? I’m watching for a clear reversal pattern on TLT to signal a potential relief rally across the board.
My primary focus for the next week is TLT. The daily chart shows it's been getting crushed, but the RSI(14) on the 4-hour chart is currently at 34 and starting to curl up from oversold territory. This could be the early signs of a bounce. For those looking for swing trading strategies that work 2026, watching these divergences is key.
- Key support for TLT: $92.50 (critical daily low from last week)
- Immediate resistance: $93.80 (prior support now resistance)
- Major resistance: $94.50 (21 EMA on the 4H chart)
- Target for a bounce: $95.20 (retest of broken trendline)
I'm looking for a clear reversal candlestick on TLT off that $92.50 support. A strong bullish engulfing or hammer on the 1-hour chart, coupled with increasing volume, would be my signal. This would be a perfect breakout trading strategy if it can reclaim $93.80.
- TLT Long Entry: Above $93.00 (after a clear bullish candle confirmation)
- Stop Loss: $92.30 (just below the recent low to protect capital)
- Target 1: $93.80 (prior resistance, R/R ~ 1:1)
- Target 2: $94.50 (21 EMA, R/R ~ 2:1)
I'll also keep an eye on BTC. If TLT manages to bounce, it might signal some stability returning, which could lead to a relief rally for crypto back towards $68,000. Marcus Cole often talks about on-chain metrics for Bitcoin, but sometimes, the macro fear subsiding is all the catalyst you need for price action to take over.
Look, nobody has a crystal ball. My thesis for a TLT bounce is invalidated if we see a sustained break below $92.00 on heavy volume. That tells me the sellers are still in full control and the 'Epic Rage' is just getting started for the bears. I’ll cut my losses quick; no sense in revenge trading after a loss. My daily routine of marking up levels on my 3 monitors is all about managing risk first. Always journal your trades, especially the losing ones, to refine your edge.
Volatility isn't chaos; it's opportunity. Price action and volume are your only true guides when the headlines are screaming.
The market is a beast, but it leaves footprints. Are you watching the same footprints, or are you just getting caught in the rage? Let me know what you're seeing in the comments below!