
📣 Create Blog for Traders!
Stop Watching news - Start Making it.
START


US Gasoline Nears $4: Is Crude Heading for a Breakout Retest?
The pumps are getting pricey, but my charts on WTI crude suggest a technical retest might offer a prime entry for the next leg up. Here's my take for March 2026.
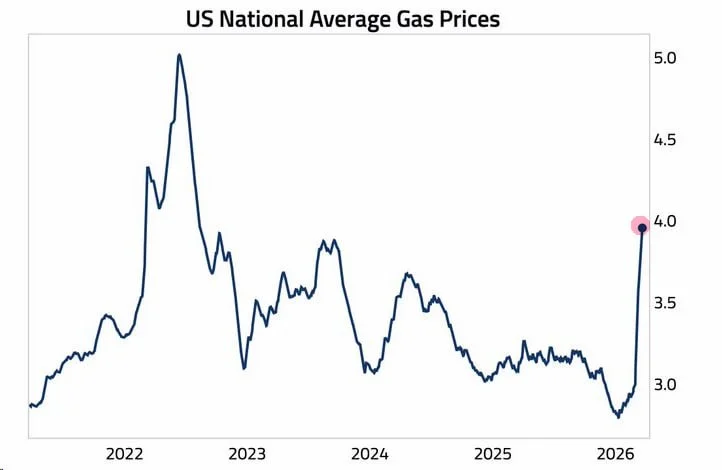
Last time we saw this kind of rip in gasoline prices, pushing toward $4.00 a gallon across the US, was back in summer 2022. Everyone was screaming about inflation then, and honestly, the vibes feel pretty similar heading into the end of March 2026. The news is all over it, saying prices are soaring, but as a day trader, I'm not just listening to the headlines; I'm looking at the charts. Specifically, I'm focused on WTI crude, which is the real driver here.
WTI crude has had a monster run, punching through its prior resistance at $82.50 earlier this week. We're currently consolidating around $83.80, which is a good sign – it's not dumping right after the breakout. However, the Daily RSI(14) is sitting at 73, definitely in overbought territory. This isn't a guaranteed sell signal, but it tells me chasing here is risky. I've learned the hard way about chasing pumps after blowing up two accounts early in my trading career. This is where knowing Alex Volkov's macro insights on energy supply can be useful, but for my daily trading, price action is king.
- Key support: $82.50 (prior resistance, now support)
- Next resistance target: $85.00 (psychological level, potential liquidity zone)
- 21 EMA (4H): Currently at $81.60, acting as dynamic support
- Volume on breakout: Strong, confirming conviction
For me, the most probable scenario is a retest of that $82.50 level. That's a textbook Ryan Cross-style setup for a breakout trading strategy. We had a strong bullish engulfing candle on the 4-hour chart that pushed us through, and now we're seeing some mild profit-taking. If we get a clean retest of $82.50 with declining selling volume, that’s my cue. I'll be looking for a reversal candlestick pattern, something like a hammer or a strong bullish wick, to confirm support and signal a long entry.
This is how to read candlestick patterns for continuation, not just blindly enter on momentum. Viktor Reyes has been calling for strong commodity demand, and while I focus on the charts, his conviction on oil strength is something I factor into my broader market view. He might disagree on the method, but the conviction is often spot on.
I'm not long WTI right now. I missed the initial rip from $80.00, and chasing here is just asking for trouble. My current plan is to wait for that retest of $82.50. My target entry would be around $82.60 - $82.70, with a tight stop loss below the 21 EMA on the 4H, say around $81.40. That gives me a clear invalidation point. If it breaks below $81.40 on strong volume, the bull thesis for this leg is off, and I'd reassess.
My initial profit target would be $85.00, which offers a solid 1.5R to 2R trade depending on the exact entry. Beyond that, the next major resistance is closer to $88.00. This kind of volume price analysis trading keeps me disciplined, especially when the market feels like it’s just pumping. It's all about managing risk and not letting FOMO get the best of you – that’s my Achilles heel, something I'm always working on.
The bullish thesis is invalidated if WTI crude breaks and holds below $81.40, especially on high selling volume. A move like that would suggest a deeper correction is on the cards, perhaps back to $79.00. Also, a sudden shift in global demand or supply, something Sarah Chen might pick up in her macro reports, could obviously nuke this setup. But purely on the charts, that $81.40 level is my line in the sand.
Don't chase the pump; wait for the retest. The best setups are often the most patient ones.
So, while everyone's complaining about gasoline prices, I'm watching for the next setup on WTI. Are you chasing this rip, or are you waiting for a cleaner entry like me?