
📣 Create Blog for Traders!
Stop Watching news - Start Making it.
START

Oil Backwardation: My Trade for the Q2 2026 Squeeze
The oil futures curve is screaming a supply panic. Most traders will play this wrong. Here's my exact playbook for the front-month squeeze.
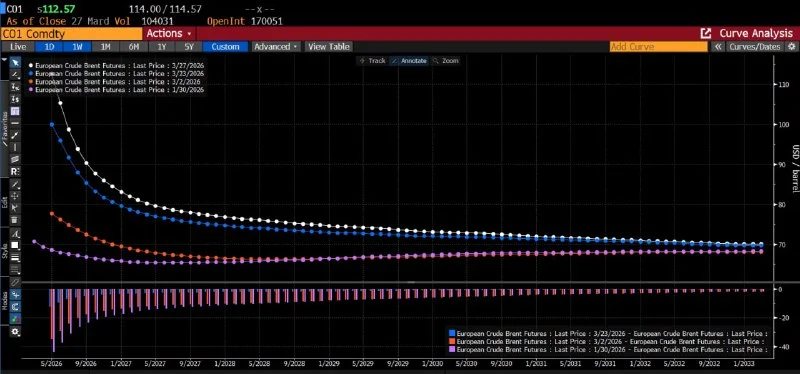
The spread between the front-month May WTI contract (CL K6) and the December contract (CL Z6) blew out to over $8 this morning. Eight dollars. Let that sink in. The market is willing to pay a massive premium for a barrel of oil *right now* versus one delivered in nine months. This isn't just a number on a screen; it's a five-alarm fire signaling a physical supply panic. Most traders are looking at this backwardation and thinking about shorting the deferred contracts. They're wrong. The real trade is to lean into the panic.
For anyone who isn't buried in futures curves all day, let's get straight to it. Backwardation is a market state where the front-month futures contract trades at a higher price than contracts for later months. It signals strong immediate demand and a tight near-term supply, often leading to sharp, fast rallies. It’s the market screaming, “I need it NOW.” This isn't theoretical. My contacts in the shipping industry are confirming what the price action is telling us: tanker schedules at Kharg Island are a mess following the recent Iranian power grid attacks. This isn't just some headline Jake Morrison might see on Twitter; it's a real disruption hitting physical barrels.
When the curve gets this steep, it means inventories are being drawn down at a frantic pace. The commercial players—refineries, airlines, nation-states—are bidding up the front month to secure supply. They don't care about the price in December; they care about keeping the lights on in May. That's the flow I want to trade with.
You don't need a fancy algorithm for this. This is old-school, supply-and-demand trading. The setup is clear, and I'm already in.
- The Catalyst: Geopolitical flare-up in Iran. This isn't vague 'tensions'; it's a specific event with a direct impact on oil loading infrastructure. It's the spark.
- The Confirmation: The backwardation in the WTI curve. This tells me the catalyst has teeth and is causing a real scramble for physical barrels. It's the fuel.
- The Execution: I'm long the May '26 WTI contract. I'm not touching the deferred months. The squeeze is at the front of the curve, so that's where I'm placing my bet.
I got long last week as the structure started to steepen. My average entry is $92.50. My stop-loss is a hard stop at $89.70, just below the 21-day EMA. If we break that, the immediate momentum is gone. My first target is the psychological $100 level. If we slice through that, I'm looking for a move to the 2024 highs around $102.80.
The consensus trade is to short the back end of the curve, betting the backwardation will collapse. It's a classic rookie mistake. In a real supply shock, the entire curve can shift higher. Your short on the Dec '26 contract at $84 might look smart, but it can easily go to $90 if the front month rips to $105. You're picking up pennies in front of a steamroller.
The real money isn't in predicting the long-term price; it's in exploiting the short-term panic reflected in the curve structure. This oil squeeze is also why my gold price forecast this week is aggressively bullish. As capital flees risk, it's not going into digital tulips. It's going into hard assets. I'm adding to my physical gold position here, and I think we'll see a gold all time high prediction become reality before Q2 is over. The high energy prices are also going to have a brutal effect on the agricultural commodities outlook later this year, but that's a trade for another day.
No trade is a sure thing. My thesis gets blown up by two things: a sudden de-escalation with Iran or a massive, coordinated SPR release from the US and its allies. The latter is unlikely given current inventory levels, but it's a risk. While a tech analyst like Emma Blackwood might just see this as an inflation data point, for commodity traders, the tape is everything. The primary signal to watch is the backwardation itself. If that $8 spread starts to narrow quickly—say, it drops below $5—that tells me the panic is subsiding, and I'll cut my position regardless of the flat price.
The market is telling you there isn't enough oil for today. Don't overthink it. Trade the front month, and ignore the noise from the back of the curve.
The setup is there. The catalyst is real. The structure confirms it. I'm sticking with my long position. But what about the rest of you? Are you playing the obvious squeeze at the front, or are you trying to be a hero shorting the back end of the curve?