
📣 Create Blog for Traders!
Stop Watching news - Start Making it.
START


Bitcoin's Weekly RSI Hits All-Time Low: My Trading Plan
This is a signal I haven't seen in my entire career. It's a generational indicator flash, and here's exactly how I'm positioning for it.
I almost made a mistake this week. A big one. Looking at the daily chart for BTC, seeing the chop around $64,000, my finger was hovering over the sell button for some of my altcoin swing positions. The price action looked weak, tired. My morning routine of checking funding rates and open interest showed a market bleeding out slowly. But before I did anything, I did what the 2018 crash taught me to do: zoom out. And what I saw on the weekly chart made me stop dead in my tracks.
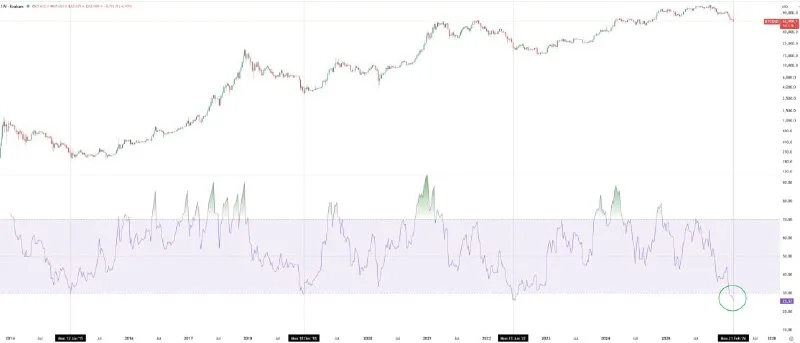
For the first time in its entire history, the weekly Relative Strength Index (RSI) for Bitcoin has dropped to its lowest reading ever. Ever. Let that sink in. This isn't just oversold; it's a historical extreme that we didn't even see at the $15,500 bottom in 2022 or the COVID crash in 2020. The RSI is the ultimate `crypto market sentiment indicator` on higher timeframes. While the daily chart whipsaws traders into oblivion, the weekly chart tells the real story of macro supply and demand. And right now, it's screaming that momentum has reached a point of absolute exhaustion.
This is a classic bullish divergence on a massive scale. Price is sitting above $64k, yet momentum is weaker than it was at $15k. The data shows that while price has held up relatively well, the energy behind the market has completely fallen off a cliff. This is the kind of setup that precedes massive trend reversals. It’s not a signal for tomorrow or the next hour; it’s a signal for the next 6-12 months.
An indicator alone is just a clue, not a conviction. So the first thing I did was flip to my other monitor and pull up Glassnode. I needed to see if the on-chain data supported this 'deep value' thesis. Exchange Netflows are showing slight outflows over the past week—not a massive rush for the exits, which is constructive. The MVRV Z-Score, my favorite for spotting generational bottoms, isn't in the green 'buy' zone yet, but it has cooled off significantly from the highs. This tells me we're getting close, but we might need one more flush to really reset things. Smart money isn't panic selling.
The RSI tells you about momentum, not price. You still need to trade the market structure. I'm mapping out the chart with very clear levels.
- Key Support Zone: The $62,500 - $63,800 area. This is the last major horizontal support.
- Invalidation Level: A weekly close below $60,000. If we lose that, the entire market structure is broken, and this RSI signal has failed.
- First Target: Reclaiming the 200-day moving average, which is sitting around $66,100.
- Second Target: A push back to the range highs near $71,500.
The biggest mistake traders will make here is going all-in with leverage. An indicator can stay oversold longer than you can stay solvent. This is a signal to begin accumulating spot positions, not to gamble on a long. The second mistake is tunnel vision on Bitcoin. A proper `bitcoin vs ethereum comparison` shows that the ETH/BTC ratio is trying to carve out a bottom. A reversal here could see capital flow back into alts, but they need Bitcoin to stabilize first. I'm also keeping a close eye on what Luna Park is covering in her `defi tokens analysis` — a risk-off BTC market can absolutely crush smaller projects, so be careful out there.
Finally, don't ignore the macro environment. My colleague Jake Morrison covers the broader markets, and with inflation data on the horizon, we could easily see a final, violent shakeout to liquidate late longs. You have to be prepared for that volatility and have your invalidation level set in stone. Don't let a wick stop you out of a career-defining position.
The market is designed to make you feel like you're wrong right before you're proven right. This historic RSI reading is the ultimate test of that principle.
So here's my plan. I'm a disciplined buyer of spot BTC in the $62,500-$64,000 zone. I added to my core position this morning. This is not a trade I'll be checking every five minutes. It's a position I'm building for the next leg of the bull market. The risk/reward of shorting at these levels, with this RSI reading, is atrocious. The real money is made by buying when you're scared, and the data is what gives you the confidence to do it.
This is a signal that demands attention. It's telling us the downside is likely limited and the potential upside is massive. The only question is, does the market have one more brutal liquidation cascade left to truly wash everyone out before the real move begins?