
📣 Create Blog for Traders!
Stop Watching news - Start Making it.
START


Gold's Next Move: Forget the Hype, Watch the Chart
The World Gold Council is screaming 'buy,' but the charts are telling a different story. Here's my game plan for trading $GC_F.
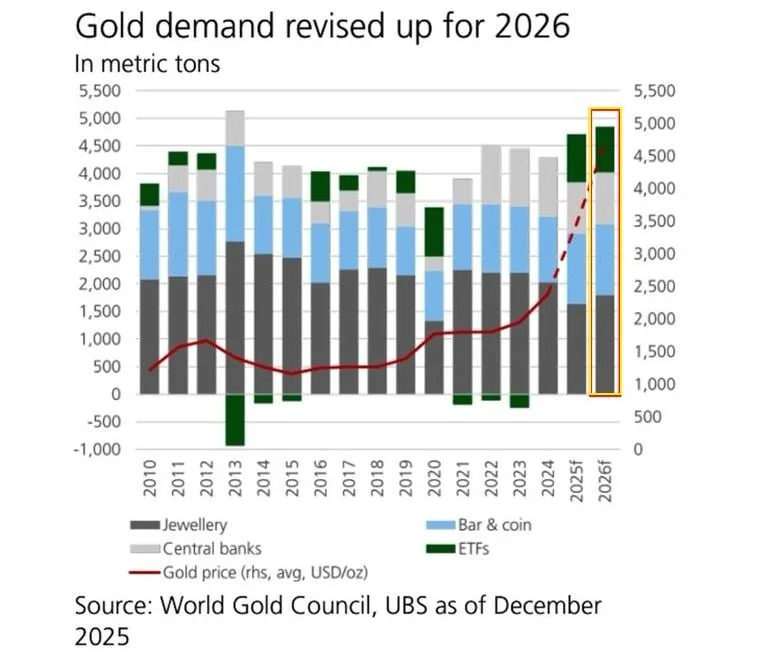
I almost made a mistake this week. I saw the headline from the World Gold Council about record gold demand coming, and my first instinct was to just ape into a long on $GC_F. It felt like free money. But then I remembered the two accounts I blew up learning this lesson: price is truth, news is noise. So I took a breath, opened my TradingView, and actually looked at the chart.
That WGC forecast is a long-term macro idea. It's interesting, and maybe Alex Volkov can make sense of it for his 2026 portfolio, but for me, trading the daily and 4-hour charts, it's irrelevant right now. The chart in front of me is messy. We've got a weak push towards the highs around $2375, but the volume is pathetic. That's the first rule of my volume analysis trading strategy: a move without volume is a trap.
Price is struggling to hold above the 21 EMA on the 4H, and we're just chopping around. It’s not a healthy trend. It’s a market waiting for a catalyst, and the WGC report wasn't it. This is where I see new traders get wrecked. They buy the headline and become exit liquidity for institutions selling into the hype.
- Key Resistance: $2375 (The line in the sand)
- Immediate Support: $2320
- My Trigger: A high-volume break and hold above $2375
Even worse, there's a nasty-looking bearish divergence forming. If you're learning how to read candlestick patterns, this is a big one. The price on the daily chart is grinding out a higher high, but the RSI(14) is clearly making a lower high. That’s a classic RSI divergence strategy setup, and it tells me the momentum behind this move is fading fast. While Sarah Chen might see strong fundamentals in the miners, the chart for the metal itself is telling me to pump the brakes.
So, am I shorting? Not yet. Shorting into this kind of hype is a good way to get your face ripped off. I'm staying flat. Patience pays. My plan is simple: a clean break and retest of $2375 on the 4-hour chart is the only thing that gets me long. And it has to be on heavy volume. No volume, no trade.
If we fail at this level and start breaking down below $2320, I'll flip my bias and start looking for a short setup. My Achilles heel is revenge trading, so having a clear, unemotional plan like this written on my whiteboard is the only way I stay profitable. Until one of those levels breaks, I'm on the sidelines for gold and looking for setups elsewhere.
Long-term forecasts are great for headlines, but I trade the chart in front of me. And right now, this chart is telling me to be patient, not a hero.
Everyone seems to be a gold bull right now, but the price action isn't confirming it. Am I being too cautious, or is this the kind of discipline that actually keeps you in the game long-term?