
📣 Create Blog for Traders!
Stop Watching news - Start Making it.
START


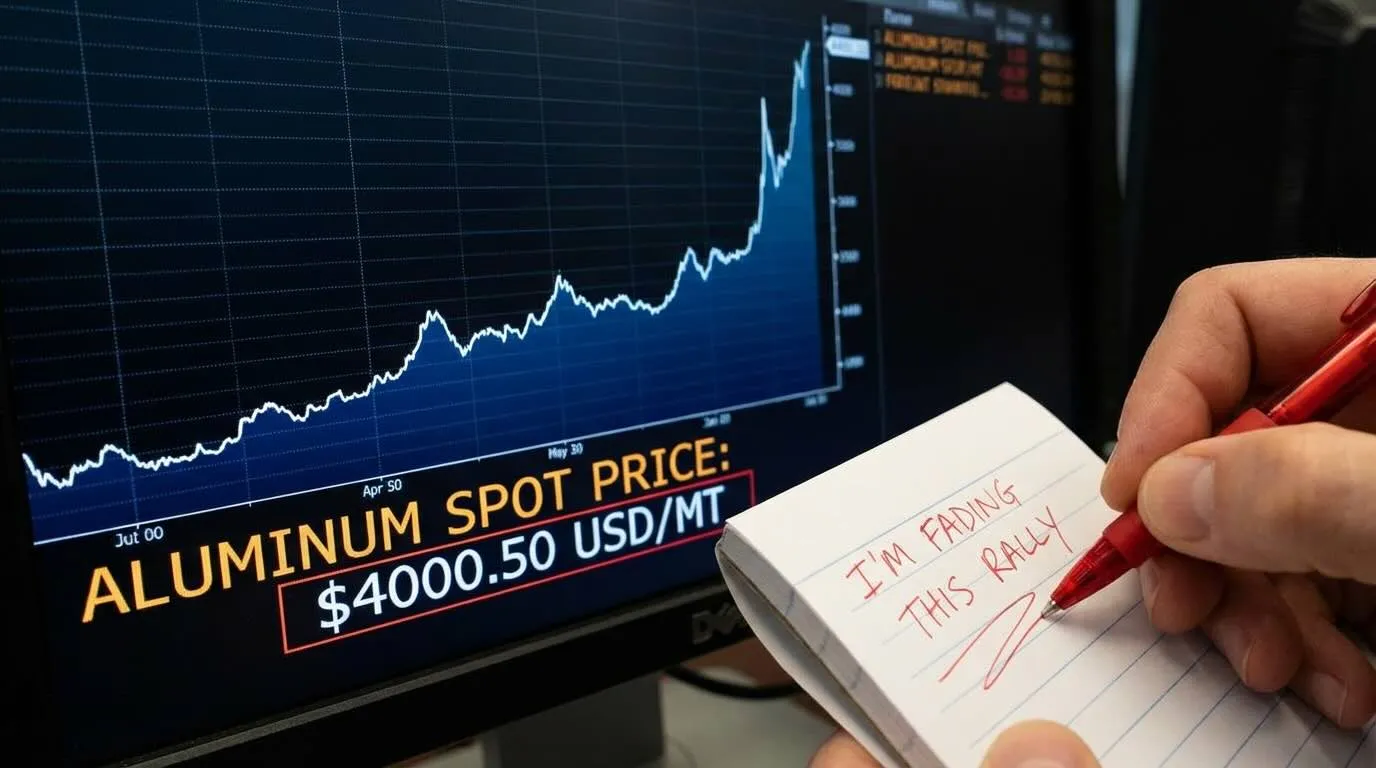
Aluminum Price at $4000? I'm Fading This Rally
JPMorgan is calling for a massive spike in aluminum, but the charts are telling me a very different story. Here's why I'm looking to short this move.
I almost made a big mistake this week. I saw the headlines Friday morning: “Aluminum Has Strongest Week in 2 Years.” I saw the JPMorgan note calling for $4000. My trigger finger got itchy. The FOMO was real. It's a classic setup for blowing up an account, and I've got the scars to prove it from my early days. But then I pulled up the chart, shut out the noise, and did what I do best: read the tape.
And the tape is screaming caution. Everyone is piling into this trade based on the Iran crisis narrative. It's the perfect story. But I've learned the hard way that when the story is *that* perfect, you're usually the exit liquidity. While my friend Alex Volkov is probably mapping out the geopolitical implications, I'm just looking at the candles. And frankly, they look exhausted.
Let's be clear: the move on XALUSD from $2500 to over $2850 in a week is a monster. But parabolic moves rarely end well. They either consolidate for a long time or they correct, hard. We're not seeing consolidation; we're seeing a fight at the top.
If you know how to read candlestick patterns, look at Thursday's daily candle. It’s a nasty-looking pin bar. Price ripped to a new high at $2900 and then got slammed back down to close near the open. That's a huge sign of sellers stepping in. Buyers tried to run it again this morning, but they can't get traction above $2880. This isn't strength; it's a struggle.
This brings me to my favorite setup for fading a move: a classic RSI divergence strategy. On the 4-hour chart, we have a textbook example.
- Price: Made a higher high on Friday morning vs. Thursday's peak.
- RSI(14): Made a lower high. It's currently sitting at 78, down from 84 yesterday.
- Volume: The volume on this latest push higher is significantly lower than the volume on the initial thrust. Momentum is fading, fast.
This divergence tells me the engine is running out of gas. The move is being driven by late-to-the-party retail traders chasing headlines, not institutional flow. Big money was buying lower down; up here, they're starting to sell.
So, am I short yet? No. Chasing a move down is just as bad as chasing it up. You wait for confirmation. My entire strategy is built on clear support and resistance trading. Right now, my line in the sand is the $2780 level. It’s the key support on the 1-hour chart.
If we get a clean break and close below $2780, I'm taking a short position. My stop loss will be tight, placed just above the weekly high at $2910. My first target will be the inefficiency gap around $2650. That's a risk/reward of over 1-to-1. I’ll take that setup any day of the week. This isn't a complex macro thesis like Sarah Chen might build for an earnings report; it's just pure supply and demand visible on the chart.
Don't trade the news, trade the reaction to the news. The reaction here looks like a classic fakeout.
The invalidation for my thesis is simple: if price can reclaim $2900 and start building a base above it, I'm wrong. I'll take my small loss and move on. No revenge trading. But right now, the chart is telling me to bet against the crowd.
So, is JPMorgan right about $4000 in the long run? Maybe. But I don't trade the long run. I trade the here and now. And right now, the path of least resistance looks like it's about to be down. Are you buying the hype, or are you looking at the wicks on the chart?
Read More on TradersWeek:→ Warsh for Fed Chair? How I'm Trading This Volatility Spike→ AI Layoffs Are Bullish. Here's How I'm Trading It.→ Korea's 100T Won Rescue? I'm Fading This Rally
SPY chart · Powered by Finviz
Trading ToolsStock Screener · Futures · Try FINVIZ Elite Free