
📣 Create Blog for Traders!
Stop Watching news - Start Making it.
START

TTF Gas Price: Goldman's €46 Forecast Is A Trap
The bank is finally waking up to the European energy reality, but their target is laughably low. I'm calling it: the real trade is for a much bigger move, and it's starting now.
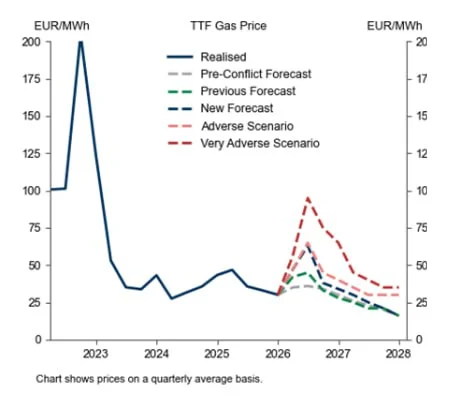
Goldman Sachs put out a note today raising their 2026 TTF gas forecast to €46/MWh. The market saw it, nodded sagely, and priced in a little bump. Most traders are wrong about what this means. They see a respected bank validating a slow grind up. I see a lagging indicator from analysts who are just now catching up to the facts on the ground. They're late to the party, and their forecast isn't a target, it's the new floor. While everyone's distracted by Bitcoin hitting $70,000 again, the real asymmetric trade is brewing in the one thing that keeps the lights on.
Let's be clear. I've been long front-month TTF futures since we broke above the €35 consolidation zone two weeks ago. My average entry is €38.20/MWh. Goldman's note is simply confirmation of a trend I've been tracking for months. The market has been lulled into a false sense of security by a mild winter and decent storage levels. But the structural deficit in European energy never went away. We're one supply disruption away from a panic.
My sources tracking LNG tanker movements out of the Gulf are reporting a significant uptick in contract diversions toward Asia, where buyers are paying a premium. This is anecdotal, sure, but it's the kind of edge you don't get from a spreadsheet. This is real-time supply getting pulled away from Europe. On top of that, the latest Commitment of Traders report shows large speculators are still stubbornly net short. That's rocket fuel for a squeeze. They're about to pay my tuition.
Goldman's €46 is a floor, not a ceiling. The market is sleeping on a return to triple-digit gas prices if even one of the major geopolitical risks escalates.
This isn't just a supply and demand story; it's a geopolitical one. The recent escalation of naval patrols near the Strait of Hormuz is not being priced in correctly. A single incident there could halt 20% of the world's LNG supply overnight. You think €46 is a bold call? Try €100. It happened in 2022, and the underlying vulnerabilities are worse now, not better. This is where a proper crude oil price analysis connects to natural gas; a disruption in the Gulf hits both markets simultaneously. While my friend Jake Morrison is skeptical about energy stocks, he's missing the point. The real leverage isn't in owning Exxon, it's in controlling the underlying commodity futures contract when volatility explodes.
I'm not just talking a big game. Here's my current position and plan:
- Position: Long TTF Gas Futures (Apr '26 contract)
- Entry: Average price of €38.20/MWh
- Target 1: €55.00/MWh (I'll take half off here)
- Target 2: €72.50/MWh (My year-end target)
- Stop-Loss: A daily close below €34.50/MWh
This is a conviction trade. I'm sized at about 8% of my trading capital. This isn't some day trade; it's a position based on my macro thesis playing out over the next 6-9 months. For those new to this space looking for a primer on futures trading for beginners, this is a classic example of combining fundamentals (supply squeeze) with technicals (the breakout above €35) and geopolitical catalysts.
I'm not an idiot. No trade is a sure thing. My thesis gets invalidated if two things happen. First, a major diplomatic breakthrough in the Persian Gulf that guarantees safe passage for all energy shipments. Second, if we see a significant global recession that crushes demand, something the macro analyst Emma Blackwood keeps a close eye on. If manufacturing PMIs start cratering across the board, I'll tighten my stop significantly. But right now, the risk is skewed massively to the upside. People are complacent, and complacency in the commodities market gets punished, hard.
As for my other positions, I continue to add to physical gold on any dips below $2,400/oz. The 'digital gold' crowd can have their fun, but I'll stick with the asset that's been a store of value for 5,000 years. If you want a good gold price forecast this week, watch the 10-year yield. If it breaks below 3.8%, gold is heading for new all-time highs.
So, the question for you is this: are you content to follow the herd and accept the timid forecasts from Wall Street banks, or are you going to look at the facts on the ground and position for the move they won't see coming until it's too late?