
📣 Create Blog for Traders!
Stop Watching news - Start Making it.
START


This 401(k) Stat Shows Why the Stock Market Could Rip or Nuke
A new report shows young Americans are 80-90% in stocks. Here's what that means for my trading plan and why I'm looking at shorts.
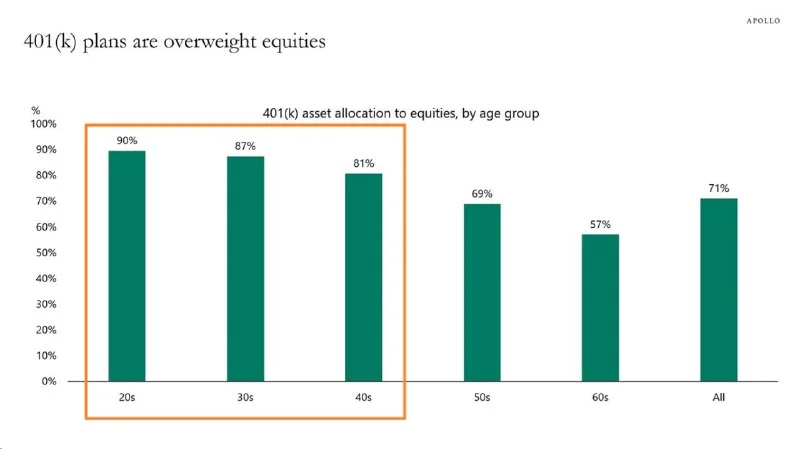
I almost made a big mistake this week. Got stopped out on a long Tuesday morning and immediately wanted to slam a revenge trade on, double leverage. Had to literally get up from my desk and walk it off. It’s my Achilles heel. But taking that breath gave me a chance to zoom out, and then I saw this Apollo stat that made everything click: 80-90% of Americans aged 20-40 are invested in equities through their 401(k)s. That’s a tidal wave of cash hitting the market every two weeks, on autopilot. And it explains this relentless, nonsensical bid we've been seeing.
This isn't some complex macro theory like Marcus Cole might break down. It's simple plumbing. A firehose of passive money is constantly spraying into the S&P 500. This is why every dip gets bought. It’s not genius hedge funds; it’s millions of automatic payroll deductions buying at any price. This creates incredibly clean technical analysis chart patterns because the underlying bid is so consistent. But it also creates a massive air pocket underneath us.
Last week, I got chopped up trying to fade the pops on the SPY. This week, looking at the chart, the structure is clear. We're in a rising wedge on the daily, and volume is starting to wane on each new high. That’s a classic sign of exhaustion.
- Key Resistance Zone: $528 - $530 on the SPY.
- Critical Support: The 21-day EMA, currently around $519.
- My Line in the Sand: A daily close below $515 opens the door to a real correction.
- RSI(14) on Daily: Sitting at 68, not overbought yet, but failing to make higher highs with price.
It absolutely could be. This constant 401(k) inflow creates a false sense of security and masks underlying weakness. When a real catalyst hits—a credit event, a jump in unemployment, whatever—these passive investors can't just hit the sell button. This forced holding pattern could turn a dip into a waterfall event as liquidity vanishes and panic sets in.
For me, the frothiest part of the market is big tech, so I'm stalking the QQQ. This is one of the best day trading setups today in my opinion, purely from a risk/reward perspective. The weekly chart is showing a potential bearish divergence. This is a classic RSI divergence strategy example: price is making a new high, but the RSI(14) on the weekly is putting in a lower high. It’s a sign the momentum is fading fast.
My plan is to wait for confirmation. I'm not shorting into a freight train. I'm waiting for it to stall. I’ll also be watching key earnings reports which Sarah Chen covers so well. A big miss from a name like NVDA or AAPL could be the catalyst that finally tips this over.
- Trigger: A 4-hour candle close below $440.
- Entry: Shorting around $439.50.
- Stop Loss: A tight stop at $444.10, just above this week's high.
- Target: First target is the support level at $428, giving me a solid 3.5R trade.
Look, I'm not a perma-bear. Price pays. My thesis is dead wrong if we get a powerful, high-volume breakout above the $530 level on the SPY and a close above $445 on the QQQ. If that happens, the 401(k) army wins this round. I'll cut the short idea, take the small loss, and look for a breakout retest to go long. You have to trade the market you have, not the one you want.
Everyone's a long-term genius in a bull market. I'm betting we find out who's actually swimming naked when the tide finally goes out.
The complacency is palpable. That Apollo stat isn't a signal of a healthy market to me; it’s a signal of a crowded trade funded by people who aren't even watching. That's liquidity now, but it's massive trapped selling pressure later. So, I have to ask: when the 401(k) money finally gets scared and looks at their statements for the first time in years, who do you think will be left to buy their bags?