
📣 Create Blog for Traders!
Stop Watching news - Start Making it.
START


Housing Market Gap Hits Record: My Top Short Trade for 2026
The gap between home sellers and buyers just hit an all-time high. I'm ignoring the noise and focusing on one chart that's screaming 'short'.
I almost made a big mistake this week. I saw the Redfin news about the record gap between home sellers and buyers and my finger was hovering over the sell button for the homebuilder's ETF, $XHB. I was itching for a win after getting chopped up on a $SOL trade Tuesday. But then I took a breath, remembered my rules, and shut down the urge to revenge trade. Price hadn't confirmed the breakdown yet. Patience pays, panic costs.
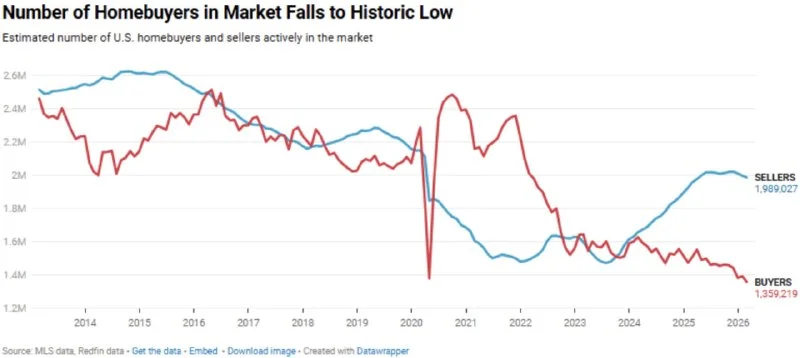
That Redfin data is no joke, though. Over 630,000 more sellers than buyers. That's a massive supply/demand imbalance. While macro guys like Marcus Cole might dive into the long-term economic implications, for me, it's simple: what does the chart say? And right now, the chart for homebuilders is looking heavy.
This isn't just a housing story anymore. It's a flashing red warning for the broader market, and the price action is finally starting to reflect it.
Last week, $XHB got rejected hard from the $105 level and has been bleeding out since. Heading into Friday's close, the price action is what matters. Forget the headlines and watch the levels. This is the core of my trading plan.
- Crucial Support: The weekly support at $97.50. This has held multiple times. A clean break and close below this is my trigger.
- Immediate Resistance: The 21-day EMA, currently around $101.20. Bulls need to reclaim this to stop the bleeding.
- Major Resistance: The prior high at $105.00. Not even on my radar right now.
- Volume Profile: A huge volume shelf sits right at $98.00. A break below that means we enter a low-volume void, which could lead to a quick flush down.
Yes, I believe it is. A breakdown below a key level after overwhelmingly bearish news is a textbook setup. This isn't a random dip; it's a fundamental shift meeting a technical weakness. When you see a catalyst this big lining up with a fragile chart, you have to pay attention. This kind of setup is one of the core swing trading strategies that work 2026 because it's based on pure supply/demand, both in the real world and on the order books.
The market is starting to price in a real slowdown. This kind of fear is probably why my friend Alex Volkov keeps a close watch on the VIX. If housing really starts to nuke, that volatility is going to spill over everywhere. Don't get caught holding the bag on growth stocks if the housing market—a huge driver of the US economy—rolls over.
I'm not short yet. I'm waiting for confirmation. A daily candle closing below $97.50 is my signal. I don't chase wicks; I wait for the close. This isn't just a breakout trading strategy in reverse; it's about waiting for the market to prove the level has failed before putting my capital at risk.
- Entry: Short on a daily close below $97.50. I'll be looking for an entry around $97.25.
- Stop Loss: A tight stop at $99.50. This is above the breakdown level and gives me a defined risk.
- Target 1: $92.00. This is the next major support zone from late 2025.
- Risk/Reward: My risk is $2.25 per share to make a potential $5.25. That's a 2.33R trade. I don't take anything less than 2R.
My thesis is invalidated if we get a sharp bounce off the $97.50 support. A big green candle on high volume from that level would tell me buyers have stepped in to defend it, and the bearish news was a fakeout. If that happens, I stay flat and look for the next setup. No ego, just reacting to what the price tells me.
Ultimately, price pays. The news is just the catalyst. The reaction on the chart is the only truth. So, with all this weakness in housing, are you seeing signs of it spilling over into your favorite stocks yet?