
📣 Create Blog for Traders!
Stop Watching news - Start Making it.
START


Hyperliquid S&P 500: Another Chart to Trade, Not a Revolution
Hyperliquid just launched S&P 500 index yesterday. Everyone's buzzing, but for me, it's just another chart to scalp. My analysis shows where the real setups are.
Alright, so Hyperliquid just dropped the S&P 500 index yesterday, March 18, 2026. Everyone's buzzing about crypto exchanges getting into TradFi, talking about mainstream adoption and the 'convergence' of markets. For me? It's just another instrument to apply my technical analysis chart patterns on. I don't care if it's traded on a DEX or the NYSE; if there's volume and a clear setup, I'm in. The news itself is cool, but it doesn't change how I trade. Price is all you need, always has been.
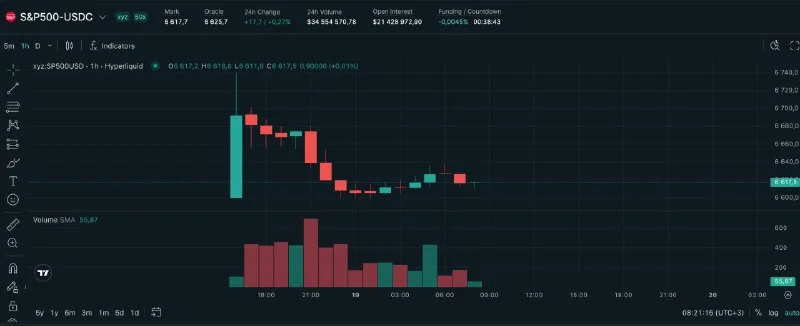
Hyperliquid officially launched the S&P 500 index yesterday, letting traders long or short one of the global market's key benchmarks. This means you can now get exposure to traditional equities via a crypto platform, which is a big deal for accessibility. For a pure price action trader like myself, it simply means another chart to add to my rotation, looking for those textbook breakout trading strategy setups without the usual TradFi hoops.
Looking at the S&P 500 (SPX) chart, it's currently consolidating around 5200, just below the all-time high of 5250. The 4H 21 EMA is acting as dynamic support, holding strong even with some wicks below it. This tight range tells me we're building energy for a significant move, and I'm watching the support and resistance levels today very closely. A clear break above 5250 on daily close could trigger a strong rip, while a dump below 5180 support could see it retesting 5100, maybe even 5050 if things get ugly.
While everyone's talking S&P, the crypto market is getting smacked this morning. Bitcoin is down 5.1% to $70,072. Ethereum at $2,166.98, down 6.4%. Solana is down 5.0% to $89.23. Most alts are getting absolutely nuked, some by double digits. This could be money rotating out of crypto into perceived safer assets, or just a healthy correction after a strong run; either way, I'm not buying bags here without confirmation. I got chopped up last week trying to catch falling knives on a few altcoin dumps, definitely a revenge trading slip-up I'm working on.
I've been tracking Bitcoin's recent move and the $69,000 level is critical on the daily chart. A sustained break below that could send us straight to $66,500, where there's significant liquidity. Marcus Cole might be looking at broader market sentiment to explain this, but for me, it's all about that volume profile around $69,000.
- BTC: Holding $69,000 is key. If it breaks, I'm looking for a short down to $66,500 with a stop above $69,500. R:R of ~1:3.
- ETH: Needs to reclaim $2,200 quickly. Below that, $2,050 is the next major support. If $2,050 gives way, we could see $1,900.
- SPX: A daily close above 5250 is a long signal for me, targeting 5300 initially. Stop loss at 5230. If it rejects 5250 and breaks 5180, I'm shorting to 5100.
The launch of the S&P 500 on Hyperliquid is a cool development, sure. It shows how crypto infrastructure is getting more sophisticated and reaching into traditional markets, something Alex Volkov often discusses in his market structure analyses. But for us, the boots-on-the-ground traders, it's just another chart. The fundamentals of trading don't change. You still need your edge, your risk management, and your discipline. Whether it's Bitcoin, Solana, or the S&P 500, the market speaks through price and volume. Period.
Don't get caught up in the narrative; the only thing that pays the bills is reading the chart right. The platform is just a vehicle, the price action is the roadmap.
So, are you going to jump on the Hyperliquid S&P 500 train, or are you sticking to your crypto guns? More importantly, are you trading the news, or are you trading the chart? Let me know your levels below!