
📣 Create Blog for Traders!
Stop Watching news - Start Making it.
START


SPY Fakeout: How I Got Wrecked Trading the Iran War Scare
Headlines screamed war and recession this week, and the charts set a perfect trap. Here's the trade that chopped me up and the key level I'm watching now.
Fear is a terrible indicator, and the charts proved it again this week. While everyone was panic-selling on Iran headlines and recession chatter, the big money was quietly setting a massive bear trap. I walked right into it, and it cost me. Here's the breakdown of the trade, the mistake, and what I'm doing now.
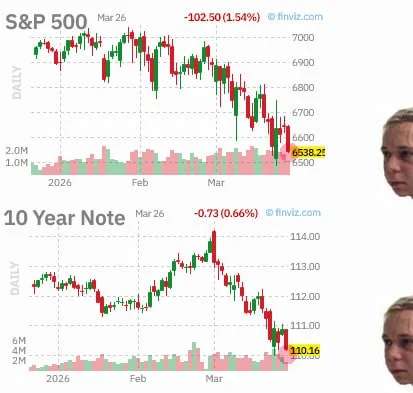
Coming into Wednesday, the market was bleeding out. The S&P 500 (SPY) was down, bonds were getting nuked, and even crypto was taking a hit—BTC under $69k, ETH threatening $2,000. The news feed was a firehose of negativity: “ground operation in Iran,” “recession fears intensifying.” It felt like the big one.
On my screen, the chart looked just as ugly. The SPY was sitting right on a critical daily support level at $515. Every bounce was getting sold into, with selling volume picking up. It was screaming, “short me.” This looked like one of the best day trading setups today: a weak market breaking a key level on high volume with a fear catalyst. I thought it was a layup.
I waited for the break. As soon as the 15-minute candle closed below $515, I jumped in short at $514.80. My stop was tight, just above the breakdown candle at $515.90. My target was the next major liquidity zone down around $508. A clean, nearly 6R trade. Easy money, right?
Wrong. The price flushed another 50 cents, then reversed with insane force. A massive wick formed on the hourly chart, rocketing price right back through the breakdown level and stopping me out for a -1R loss. A perfect, brutal fakeout. My Achilles heel—getting aggressive on what looks like an “obvious” move—bit me again. I was so tempted to revenge trade and go long, but I walked away. Progress.
This fakeout is a huge piece of information. While the headlines are bearish, the price action showed massive buy-side demand right below $515. This is a classic lesson in how to read candlestick patterns; that long lower wick was a signal that buyers absorbed all the panic selling and then some. This is exactly the kind of noise Marcus Cole talks about fading in his crypto analysis. While macro guys might see a recession coming, the order book just told us someone with deep pockets is defending that level.
The failed breakdown completely changed my perspective. That stop-hunt showed the market's hand. Now, my entire thesis pivots around that $515 level on the SPY.
- Key Pivot: $515. As long as we hold above this, the bulls who bought that dip are in control.
- Upside Resistance: $522. This is the first major hurdle. A clean break here and we could see a quick rip to all-time highs.
- Downside Invalidation: $512. A close below this level would mean the fakeout was a fakeout (yes, that happens) and the bears are back in charge.
- Volume: I need to see volume decline if we grind higher, and spike if we test the lows again. Volume precedes price.
My plan now is simple: I'm not shorting unless we get a daily close below $512. I'm actually stalking a long entry on a retest of the $515-$516 zone. It's a contrarian play, and it feels uncomfortable, which is usually a good sign. It's one of the few swing trading strategies that work 2026 — fading the emotional herd at key technical levels. It's a pure price action play, the kind of thing Alex Volkov probably shakes his head at, but price is the only truth I trust.
The market's job is to create the most pain for the most people. This week, the pain was shorting the scary headline right into a massive support level.
That trade was a good, cheap lesson. Don't let the news dictate your entries. Let price confirm the story. The story this week was that the bears aren't as strong as the headlines make them seem. So, are you trusting the charts or the news feed heading into the weekend?