
📣 Create Blog for Traders!
Stop Watching news - Start Making it.
START


CTAs Dump $190B in Stocks: A Trader's Guide to the Dip
The biggest quant sell-off since the COVID panic is here. I'm not running for the hills. Here's my game plan for buying this fear.
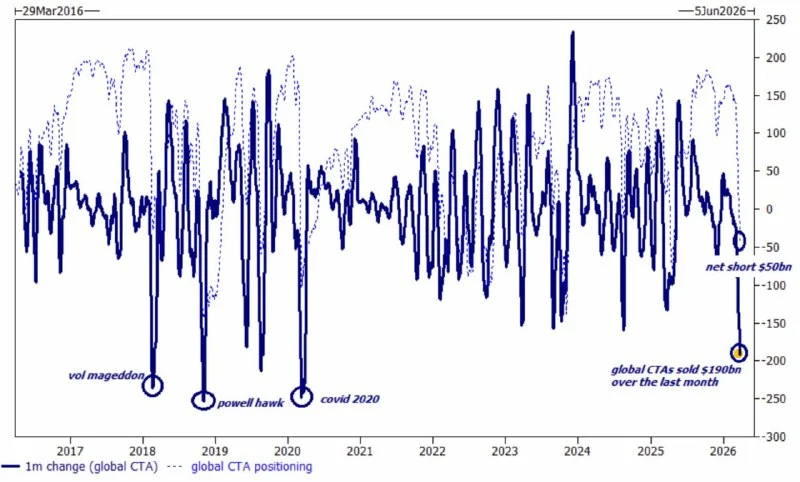
The headlines are screaming panic, but the charts are whispering opportunity. That's my takeaway from the Goldman note that CTAs just dumped a massive $190 billion in global stocks. Everyone's comparing it to the March 2020 COVID nuke. I get it, it's a scary number. But I'm not convinced it's the same setup. Not even close.
First, let's get something straight. CTAs, or Commodity Trading Advisors, are systematic trend-followers. They buy what's going up and sell what's going down. By definition, they are almost always late to the party. This huge selling pressure tells me more about the trend that *just happened* than the one that's about to start. They're selling into weakness after the drop, not at the top.
I'm looking at the S&P 500 (SPX) chart right now, and the story is different. We're coming into a major support zone around 5225, which was the breakout level from early March. More importantly, the volume on this sell-off has been declining. That's not what you see in a real panic. A real panic has expanding, climactic volume. This feels more like a forced, systematic de-risking than genuine fear.
For me, this is a potential buying opportunity, but only on confirmation. This isn't the time to blindly catch a falling knife. The key is waiting for price to prove the sellers are exhausted. Knowing how to read candlestick patterns is your entire edge here. I'm watching the daily chart for a bullish engulfing candle or a strong hammer right off that 5225 support level. That's my trigger.
The macro guys might be worried about broader trends. I saw Alex Volkov's latest piece on global liquidity, and he makes some good points. But price pays. Right now, the 4-hour RSI on the SPX is sitting at 32, flirting with oversold. If we get a bullish divergence here — price making a lower low while the RSI makes a higher low — I'm taking that shot.
Talk is cheap. Here are the exact levels on my whiteboard for the week ahead. This is where my day trading risk management rules come into play — every entry has a pre-defined exit.
- SPX Long Trigger: A daily close back above 5280. That would signal a failed breakdown and trap the late shorts.
- Invalidation Level: A daily close below 5200. If that happens, my thesis is wrong, and I'm out. No questions asked. Revenge trading is my Achilles heel, so I have to be disciplined here.
- BTC Relative Strength: Bitcoin is holding up incredibly well, currently at $67,539. If stocks find a bottom, I fully expect $BTC to rip towards $70,000 first. It's leading the market.
- Ignore Earnings Noise: Sarah Chen does a great job breaking down the fundamentals, but in a market this technically-driven, I find earnings reactions can be pure noise. I'm fading any earnings-related pops or drops until the index finds its footing.
Everyone sees the CTA selling and panics. I see a massive, forced transfer of shares from weak, systematic hands to potentially strong, discretionary hands right at a key support level.
This is a classic fear vs. greed setup. The news is bearish, but the price action is showing signs of exhaustion. These are the moments that define your quarter if you get them right. I'm leaning toward greed, but with a very tight leash.
So, am I crazy for wanting to buy this dip while the quants are puking, or is this the textbook shakeout before the next major leg higher?