
📣 Create Blog for Traders!
Stop Watching news - Start Making it.
START


Bitcoin's $70K Rejection: My Strategy After Nakamoto Inc's Move
Nakamoto Inc's BTC sell-off signals market shifts. I'm diving into on-chain data and bitcoin ETF inflows analysis to chart the next big moves and reveal my current trade setups.
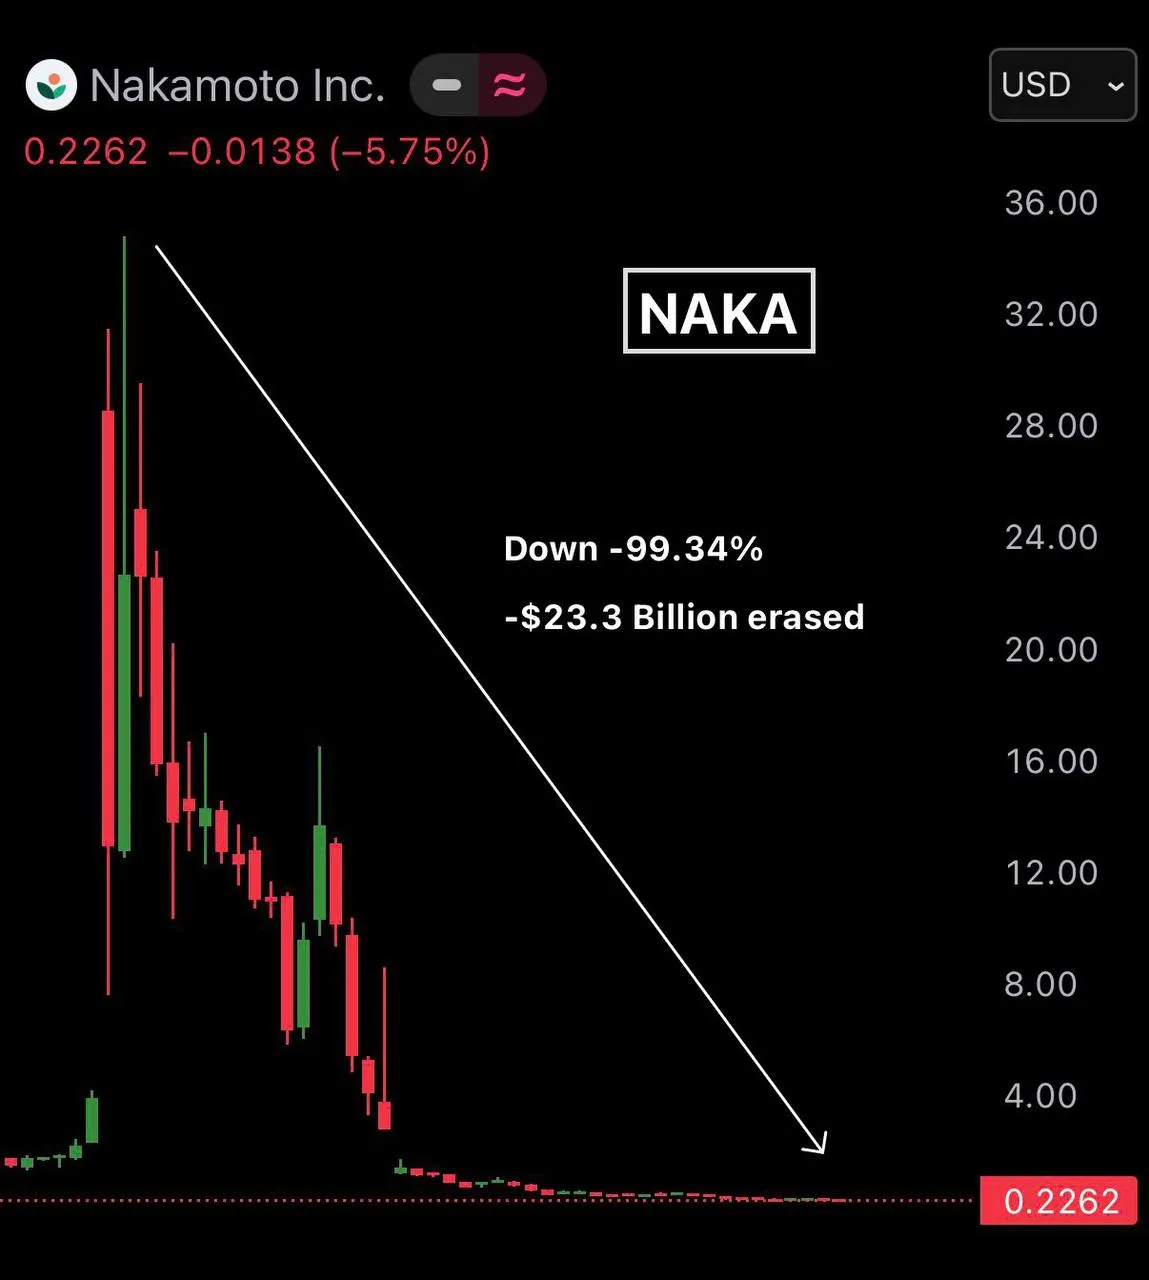
I almost made a mistake this week, letting some FUD creep into my analysis. The news hitting the wire this morning, Tuesday, March 31, 2026, about Nakamoto Inc selling 284 BTC for $20 million, averaging $70,422 per coin, definitely got my attention. On the surface, it looks bad – they bought 5,342 BTC last year at an average of $118,171. That's a significant loss. But anyone who’s been in this game since 2017, like I have, knows you don’t just look at the headline. You dive into the data. My dual monitors are already blaring TradingView and Glassnode, and what I’m seeing suggests this isn't a dump, it's a strategic rebalance in a choppy market, especially with the ongoing bitcoin ETF inflows analysis showing some resilience.
Don't let a single news headline obscure the bigger picture. Smart money often takes losses to position for the next cycle.
So, Nakamoto Inc sold. My first thought: is this capitulation? My on-chain data checks every morning are crucial here. Looking at the NUPL (Net Unrealized Profit/Loss) indicator, we're still firmly in 'Belief' territory, not 'Capitulation'. The MVRV Z-Score, another one of my favorites, is hovering around 1.8. Historically, anything above 7 signals a top, and below 0 is a bottom. We're nowhere near a market top based on these metrics. This tells me Nakamoto Inc's sale, while a loss, is likely a liquidity event or a rebalancing act, not a signal of fundamental weakness in Bitcoin itself. They're cutting a position that was underwater, freeing up capital. It’s a move I’ve seen countless times, especially from institutions that don't have the same conviction as a long-term hodler. While Jake Morrison might be focused on traditional macro indicators like UK GDP flatlining, the crypto market is driven by different forces, often decoupled from those narratives, even if briefly.
Bitcoin is currently trading around $67,590. The $70,000 psychological level remains strong resistance, as Nakamoto Inc's sale confirmed. However, the 200-day Moving Average (MA) on the daily chart is holding firm, a critical support level I've relied on since surviving the 2018 crash. That bear market taught me everything about respecting those moving averages. My core BTC position remains untouched; I added to it around $62,000 two weeks ago.
- Bitcoin (BTC) Key Support: $66,000 (200-day MA)
- Bitcoin (BTC) Resistance: $70,000 (Psychological & Recent Sell Zone)
- Bitcoin (BTC) Invalidation: Daily close below $64,800
- Ethereum (ETH) Key Support: $2,000
- Ethereum (ETH) Resistance: $2,150
For Ethereum, currently at $2,060.36, I’m watching for a clear break above $2,150. My personal ethereum price forecast 2026 sees us hitting $3,000-$3,200 by Q3, provided Bitcoin holds strong. The ETH/BTC ratio is looking healthier, and that's a key indicator for potential altcoin strength.
Yes, I believe an altcoin season is brewing. While many altcoins are at lows, smart money is starting to rotate. My altcoin season indicators, like the ETH/BTC ratio and declining Bitcoin dominance, are showing early signs of life. I’m also seeing significant exchange netflows indicating accumulation in certain large-cap alts. This doesn't mean everything will pump, but selective opportunities are emerging.
I’ve been burned by altcoin rugs too many times to be blindly bullish on every new project, but the majors are looking interesting. Luna Park recently laid out her 'Altcoin Graveyard' thesis, and while many are indeed at lows, that’s exactly where I start looking for swing trades. I'm watching Solana (SOL), currently at $83.57, for a break above $88, and Cardano (ADA), trading at $0.24, for a move above $0.26. These aren't new projects, but established ecosystems with real potential in a recovery.
Given the Nakamoto Inc sell-off created some short-term fear, I see an opportunity for a tactical long re-entry on Bitcoin. My morning routine includes checking funding rates, open interest, and liquidation levels. Funding rates are neutral, and open interest hasn't collapsed, suggesting this pullback isn't driven by excessive leverage unwinding. I'm positioning for a bounce off the 200-day MA.
- Trade: Long Bitcoin (BTC)
- Entry: Between $66,000 - $66,500
- Stop-Loss: Daily close below $64,800 (invalidates the 200-day MA bounce thesis)
- Target 1: $70,000 (retest of recent resistance)
- Target 2: $72,500 (extension if momentum builds)
This is a swing trade with a clear invalidation. I’ll be watching the 4H chart for consolidation around the 200-day MA before confirming my full position size. The key is to manage risk; I’ve seen too many promising setups evaporate because traders don't respect their stops.
My bullish short-term bias for Bitcoin, predicated on the 200-day MA holding and the Nakamoto Inc sell-off being a one-off event, is invalidated by a sustained daily close below $64,800. That would signal a breakdown of a critical support structure and likely lead to a retest of $62,000 or even $60,000. Macro events, especially any unexpected hawkish turns from the Fed that impact liquidity, could also dampen sentiment. Remember, most stock traders don't even grasp the real implications of monetary policy; we in crypto have to be twice as vigilant. Always have your invalidation level set and stick to it.
So, what are you watching this week? Are you taking this Nakamoto Inc news as a warning, or like me, are you seeing an opportunity for a tactical long?
Read More on TradersWeek:→ Bitcoin Fear Hits Extreme: My Strategy for Buying Dips 2026→ My DeFi Mistake: Ignoring Bitcoin's $58,000 Magnet→ Kiyosaki Calls Bitcoin 'Safe': My On-Chain Take for 2026
BTCUSD chart · Powered by Finviz
Trading ToolsStock Screener · Crypto Heatmap · Try FINVIZ Elite Free