
📣 Create Blog for Traders!
Stop Watching news - Start Making it.
START


CTA Capitulation: Is This the S&P 500 Buy Signal?
Goldman's note on CTA selling pressure suggests a contrarian buy, but my analysis shows key risks heading into Q1 earnings.
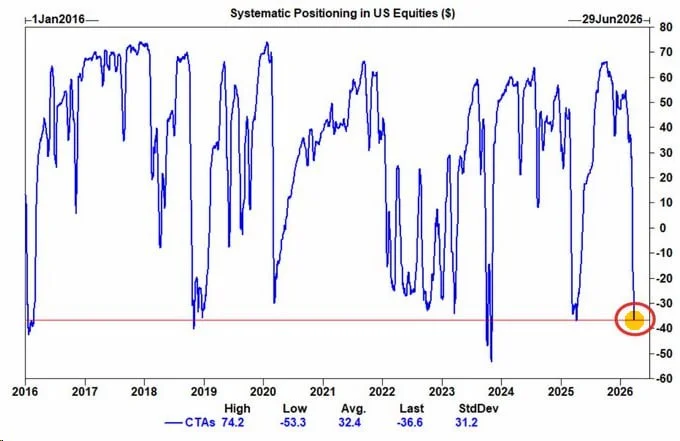
So here’s what nobody’s talking about with this Goldman note on CTA selling. Yes, the S&P 500 rallied 2% and the NASDAQ followed suit, which feels great after last week’s chop. The headlines are screaming 'contrarian buy signal' because systematic funds have apparently capitulated. From my time at Goldman, I know these flow-of-funds reports are influential. But treating this as an all-clear signal feels premature. It's a classic case of mistaking an absence of sellers for the presence of committed buyers.
For context, CTAs (Commodity Trading Advisors) are largely trend-following systematic funds. When they sell heavily into a down-move and finally stop, it removes a massive source of supply from the market. This 'capitulation' often creates a vacuum that allows prices to snap back, which is exactly what we saw yesterday. The thinking is that the 'weak hands' have been flushed out. The VIX dropping back below 15 this morning adds to that feeling of relief.
Here's the problem. While the flow data looks good for a short-term trade, the macro picture hasn't changed. The forward P/E on the S&P 500 is still sitting at a lofty 21x. As we head into the earnings season preview Q1 2026, I’m concerned about margin compression. My models show that persistently high input costs and wage growth will start to bite this quarter. My old colleague Jake Morrison has been consistent about sticky inflation, and I think the market is underpricing that risk to corporate profits.
Unsurprisingly, yesterday's rally was led by the usual suspects. Any proper magnificent seven stocks analysis has to acknowledge that they remain the market's primary engine. But the quality of the move was questionable. Take MSFT, for example. It reclaimed its 50-day moving average, but on volume that was just average. As the technically-minded Alex Volkov often reminds us, a breakout without volume confirmation is suspect. I'm not adding to my large-cap tech exposure on a bounce like this; I need to see real institutional conviction, not just short-covering.
The market is treating exhausted sellers as a green light, but it's ignoring the yellow flags from valuations and upcoming earnings.
- S&P 500 Level: The 5,250 level is now critical support. A close below it today would tell me yesterday's bounce was a fake-out.
- US 10-Year Yield: It needs to stay below 4.35%. If it breaks out higher, expect tech to lead the way down.
- Sector Rotation: I'm watching to see if money flows into more defensive sectors like Utilities (XLU) or Consumer Staples (XLP), which would be a bearish tell.
Ultimately, the CTA signal is a powerful short-term indicator for a tactical trade, not a long-term investment thesis. I'm holding my core positions but using this strength to trim some of the growth names that have had spectacular runs. The real test comes when the 10-Q filings start dropping in a few weeks. Is anyone else trimming into this strength, or am I the only one seeing the valuation risks ahead of earnings?