
📣 Create Blog for Traders!
Stop Watching news - Start Making it.
START


S&P 500 Concentration Hits Bubble Levels: My 2026 Game Plan
A Bank of America chart is screaming 'market top.' But as a trader, I only trust price. Here's how I'm playing the S&P 500 right now.
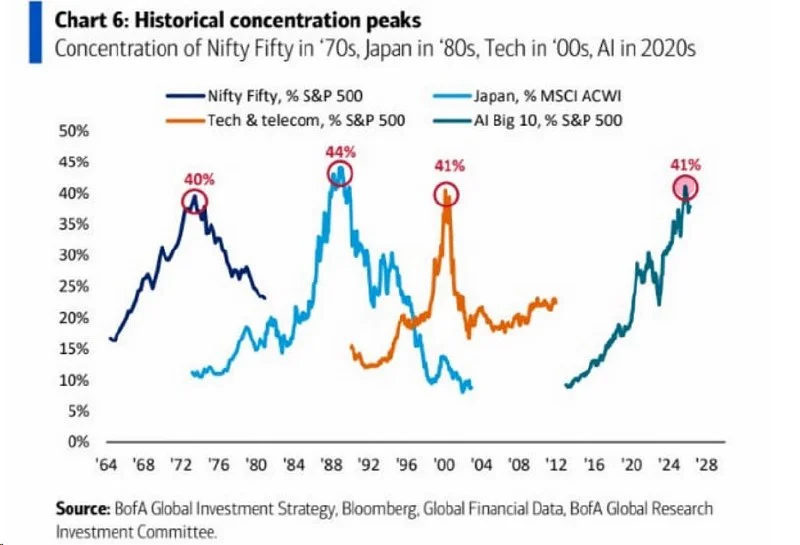
I almost made a big mistake this week. A really dumb one. I saw that scary Bank of America chart making the rounds—the one showing S&P 500 concentration at dot-com bubble levels—and my finger twitched over the 'sell' button. The narrative felt right. The fear felt real. For a second, I forgot my most important rule: headlines don't pay the bills, price does.
Let's be clear, that chart is ugly. It shows the top 10% of U.S. stocks making up 41% of the S&P 500's weight, a level that historically precedes a nasty dump. But a chart showing conditions are ripe for a storm isn't the same as the storm actually hitting. I've learned the hard way—blowing up two accounts before I got this—that you can't short a 'story'. You can only short a breakdown in price structure.
The data is what it is. When a handful of stocks, namely the 'Magnificent Seven,' carry the entire market, the foundation is shaky. We saw this in 2000. We saw it with Japanese stocks in the late '80s. It's a classic late-cycle signal. The problem is, 'late-cycle' can last a lot longer than your margin account can. For months, you could have just blindly bought $NVDA or $MSFT and looked like a genius. But lately, the generals are getting tired.
I've been tracking this on my main monitor for weeks. The S&P 500 Equal Weight ETF ($RSP) has been lagging the cap-weighted $SPX significantly. This is a massive tell. It means the average stock isn't participating in the rally. The soldiers are falling back while a few super-cap generals make a final, desperate charge. That's not strength; that's a warning.
The AI narrative has been the primary fuel for this market melt-up. The problem is, narratives eventually collide with reality. While AI spending is high, the market is getting impatient for that spending to translate into blowout earnings across the board. If that doesn't happen, the story falls apart, and the high valuations become impossible to justify.
Frankly, I don't care about the long-term AI story. Alex Volkov can break down the tech fundamentals way better than I can. I just trade the chart in front of me. And right now, the chart of the VanEck Semi ETF ($SMH) is showing a textbook RSI divergence strategy example on the weekly timeframe. Price scraped a new high back in February, but the RSI(14) printed a clear lower high. That's exhaustion. It's a signal that the biggest momentum engine of this market is running out of steam.
So what am I actually doing? I'm not blindly shorting. That's a fool's game. I'm waiting for price to confirm the weakness everyone is talking about. My whiteboard is covered in levels for the $SPY, and I'm watching them like a hawk. This is where my focus on day trading risk management rules becomes critical to surviving the chop.
- Key Support: $505. This was the prior resistance from the February breakout. A daily close below this level is the first major crack in the armor.
- The Line in the Sand: $480. This area lines up with the 200-day moving average. A break below this, and it's likely lights out for the bulls for a while.
- Immediate Resistance: $525. This is the current all-time high zone. I'm not interested in longs unless we get a powerful break and hold above this level on high volume.
My primary setup is waiting for that break of $505. A clean breakdown, followed by a retest of that level from below that gets rejected—that's my A+ short entry. That breakdown-retest is one of the classic swing trading strategies that work in 2026 because it's based on a clear shift in market structure. Until then, it's small size and quick profits. I got chopped up two weeks ago revenge trading after a stupid loss, and I'm not letting my psychology get the best of me in a tricky environment like this.
The BofA chart is a symptom, not the disease. The real risk is the deep-seated belief that the market can only go up, that every dip is for buying, and that the Fed will always step in. Geopolitical noise like 'Operation Epic Fury' is just a potential catalyst, the spark that could light the fuse. The real danger is the mountain of complacent long positions built on a shaky foundation.
I'm seeing this complacency in the volume data. As Marcus Cole pointed out recently with crypto, volume has been pathetic on some of these recent pushes higher in the equity markets. It shows a lack of broad participation and conviction. Low-volume rallies are fragile. They are easy to push over.
Charts don't predict the future, but they show you the battlefield. Right now, the battlefield is tilted, and the bears are finding higher ground.
The setup for a significant correction is there. The narrative drivers are weakening. The technicals are showing cracks. Now, we just wait for price to give the signal. The question I have for everyone reading is this: are you actually changing your strategy based on these warning signs, or are you still buying every 1% dip assuming the party never ends?