
📣 Create Blog for Traders!
Stop Watching news - Start Making it.
START


Energy Stocks vs. S&P 500: The Breakout I'm Not Buying
The XLE/SPY ratio is trying to break a 10-year downtrend. Here's why I think it's a massive bull trap in the making.
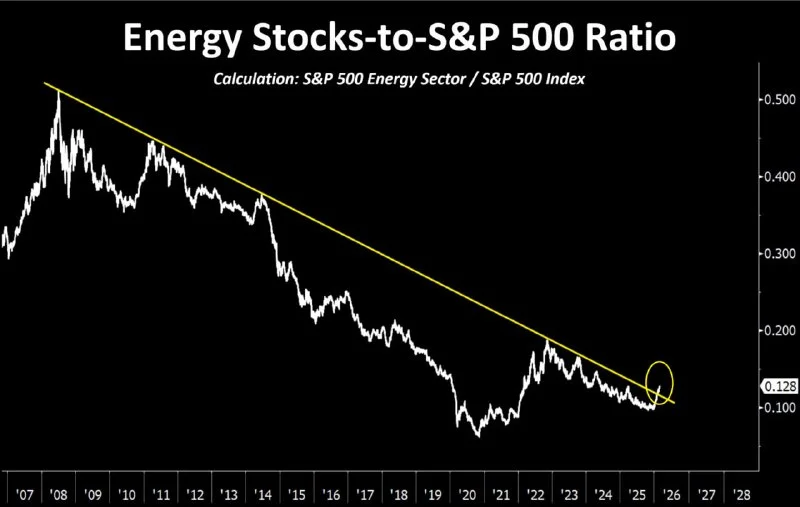
The chart that has my full attention this week isn't Bitcoin or some new altcoin. It's the XLE/SPY ratio. For the first time in what feels like forever, this ratio—pitting the energy sector against the broader market—is poking its head above a decade-long descending trendline. The internet is screaming breakout. Me? I'm sitting on my hands, and I think you should too. This has all the makings of a classic fakeout.
Look, I get it. The price action looks explosive. We're testing the 0.185 resistance level on the ratio chart, a level that has capped every rally for years. But price without volume is just noise. And the volume on this push higher in XLE is looking thin. Anemic, even. A true, sustainable breakout needs a surge of buying pressure to confirm it. We're not seeing that. This looks more like a slow, tired grind into a brick wall.
This is textbook support and resistance trading, and what I see is a market testing a major ceiling. While a fundamental analyst like Sarah Chen is probably digging into oil demand forecasts, my chart is telling me the buyers are getting exhausted right where you'd expect them to.
- Resistance: The 0.185 - 0.187 zone on the XLE/SPY ratio is the line in the sand. A weekly close above this with huge volume would start to change my mind.
- Key Support: The first sign of trouble will be a rejection and a close back below 0.180. That's my trigger to look for shorts.
- The Tell: I'm watching a nasty bearish RSI divergence strategy play out on the daily chart. Higher price highs, lower RSI highs. That's a classic warning sign.
I'm not touching the long side here. Chasing a move into decade-long resistance after it's already run this hard is just bad risk management. It's how I blew up one of my first accounts. My approach is simpler and doesn't rely on complex models like the ones Alex Volkov builds; it's just pure price action.
My plan is to wait for the rejection. If we see a hard sell-off from this level and a daily close back inside the old range, I'll be looking to short XLE or specific over-extended names like XOM or CVX, using the recent high as my stop loss. The risk/reward on that trade is infinitely better than buying the top here.
Chasing a decade-long trendline break on its first try is a textbook way to get chopped up. Patience pays, aggression costs.
If I'm wrong, I miss some upside. Fine. Preserving capital is job number one. But if I'm right, we're about to see a nasty reversal that will trap a ton of breakout traders. So, am I being too cautious, or is this the biggest bull trap of 2026?