
📣 Create Blog for Traders!
Stop Watching news - Start Making it.
START


Oil Prices & SP500: Is This Crisis Different Than History?
Deutsche Bank's historical data on geopolitical shocks is making the rounds. Here's why I think their playbook is a trap for retail traders in 2026.
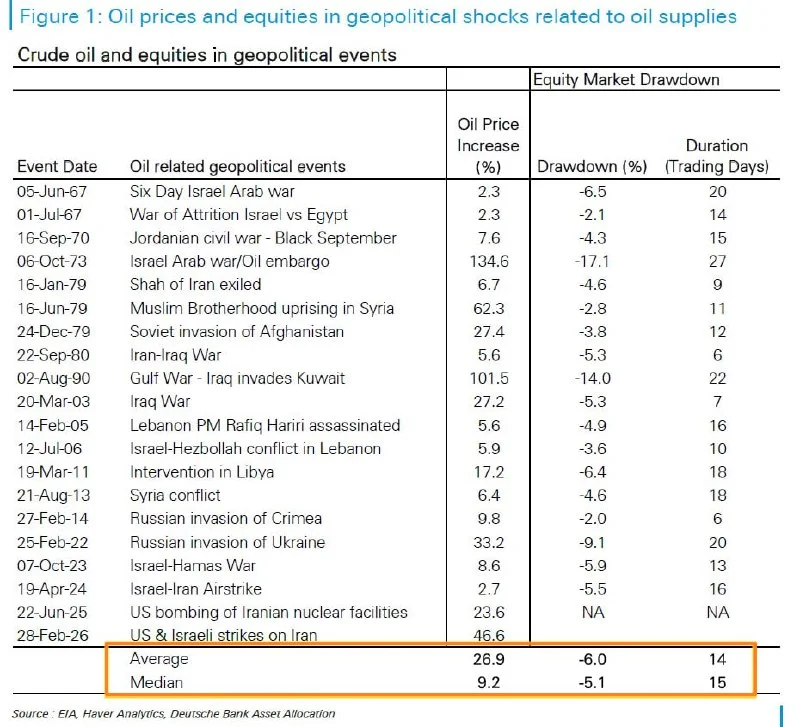
So that Deutsche Bank table is everywhere this morning. You've seen it. Historically, geopolitical crises cause oil to rip +27% and the S&P 500 to dump -6% on average. The catch? We've already seen a +47% move in oil and a -5% drop in the SPX. The news is out. The move has happened. Relying on historical averages now is like driving by looking in the rearview mirror. Price is all that matters, and the charts are telling a very different story than the headlines.
This is a classic blow-off top in the making on WTI (crude oil). The move from $80 to over $115 was violent, but the volume price analysis trading signals are flashing red. We saw a massive spike in volume right at the peak last week, followed by a sharp rejection wick on the daily candle. That's not strength; that's late-to-the-party buyers providing liquidity for smart money to unload their bags. The historical average is irrelevant when price action signals the move is already overextended.
To be clear: when oil prices spike this much, it's not a sign of a healthy market. The move is driven by fear, not fundamentals. On the 4-hour chart, the RSI(14) printed a nasty bearish divergence, making a lower high while price made a higher high above $115. That's my signal to start hunting for shorts, not joining the panic longs. As Marcus Cole often points out, macro narratives can drive markets, but I'll always trust the tape over the story.
- Resistance: $115.50 (last week's high, major rejection point)
- Key Pivot: $110.00 (A break below signals loss of momentum)
- Support: $104.75 (First logical target for a pullback)
- Invalidation: A daily close above $116.00 would mean I'm wrong and the trend continues.
The S&P 500 looks ugly, no doubt. But it's holding where it needs to. We're currently testing the major support zone around 4625-4650. This isn't just a random number; it was the major resistance and breakout point from Q4 2025. A classic breakout-retest setup. While everyone is panicking, I'm watching for buyers to step in and defend this zone. The selling volume has been decreasing on this latest leg down, which suggests seller exhaustion.
This isn't to say we're guaranteed a V-shaped recovery. There's real fear out there. But remember, the market's job is to frustrate the maximum number of people. Right now, everyone is positioned for a nuke. I'm looking for signs of a reversal. A strong daily close back above 4700 would be my first signal that the low is in. It's also worth keeping an eye on earnings season; Sarah Chen's analysis will be crucial to see if fundamentals can provide a floor here.
I'm not positioned long or short at this exact moment, I'm waiting for confirmation. My plan is simple: fade the extremes once price action confirms it. I'm stalking a short on WTI on a breakdown below $110, with a stop above $112.50. For the SPX, I'm looking for a potential long if we see a strong bullish engulfing candle off the 4625 support, with a tight stop below the low. My biggest challenge, as always, will be staying patient and not revenge trading if the first setup fails me. Got chopped up a bit last week doing just that.
History rhymes, but it doesn't repeat. Trading off 'historical averages' is a great way to become a very average, and likely unprofitable, trader.
The data is useful context, but it's not a trading signal. The herd is panicked about oil going to $150 and the market crashing. When sentiment is this one-sided, it pays to look the other way. So, is the real contrarian trade a sharp reversal, or are we just pausing before the next catastrophic leg down?