
📣 Create Blog for Traders!
Stop Watching news - Start Making it.
START


S&P 500 Seasonality Is Broken: Why I'm Ignoring History
March seasonality says we should be dipping, but the charts are screaming higher. I'm breaking down why price action is king and sharing my exact trade plan for the SPY.
Last time the S&P 500 seasonality models got this disconnected from reality was right before the massive Q4 2023 rip. I'm seeing the chatter everywhere this week: the S&P 500 is way off its historical average for March. The stats guys are calling for a pullback. But I'm looking at the chart, and all I see is a bull flag getting ready to send it. Price is truth. Everything else is just noise. Marcus Cole has been skeptical about this stock rally's strength, and I get it, but the tape doesn't lie. My thesis is simple: in 2026, you either trade the price action in front of you or you get run over by it.
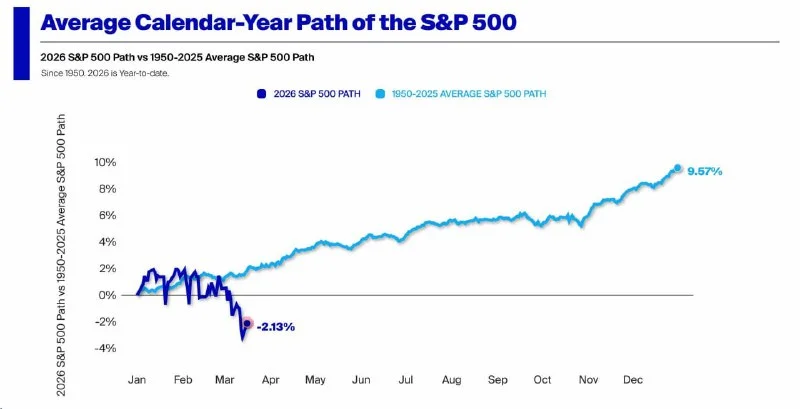
Let's give the other side its due. The argument for a dip here is based purely on historical data. March is often a messy, choppy month for equities. You get portfolio rebalancing near the end of Q1, tax-related selling... it's typically not a clean ride up. When you look at the averages over the last 20 years, the S&P 500 usually grinds sideways or even pulls back slightly mid-month before a potential end-of-quarter push.
- Historical March Performance: Averages a modest gain, but with significant mid-month chop.
- Current Month-to-Date: The SPY is up over 3%, which is a major deviation.
- Complacency Signal: The VIX is pinned below 14, which some see as a sign that the market is too calm and due for a shock.
- The Fed: Still a wildcard. Any hawkish talk could easily trigger the 'overdue' correction.
So, if you're a pure stats trader, you're probably getting short here or at least taking profits. You're betting on a reversion to the mean. It's a logical trade, on paper.
But I'm not a stats trader. I'm a tape reader. And the tape is telling a completely different story. This is where knowing how to read candlestick patterns separates you from the crowd. We had a small pullback last week that was bought up instantly, forming a bullish hammer on the daily chart. Since then, we've been consolidating in a tight range right below the all-time highs. This isn't weakness; this is compression. It's the market coiling for its next move.
I trade the SPY because the volume is clean. Right now, the entire structure is bullish until proven otherwise. The bulls are defending the $510 level like their lives depend on it. That level also lines up perfectly with the 21 EMA on the 4-hour chart, which is a key moving average for my strategy. Volume profile shows a massive node of support building in the $505-$507 zone. We'd need to see a catastrophic failure there to even consider getting bearish.
- Key Micro-Support: $512 (intraday pivot)
- Must-Hold Daily Support: $510.50 (21 EMA 4H)
- Major Demand Zone: $505 - $507
- Resistance / Target 1: $518 (all-time high)
- Target 2 (Breakout): $525 (measured move)
This is the ultimate battle: historical probability versus present-day reality. A quant like Alex Volkov might build a fantastic model showing a 70% chance of a pullback based on past Marches. I respect that approach, but it's not how I make money. My edge comes from seeing the order flow and momentum *right now*. In a powerful trend, historical patterns get tossed out the window. The market doesn't have a memory; it has a flow of orders.
Fighting a strong trend because a historical model says it *should* reverse is one of the fastest ways to blow up an account. It's a form of revenge trading against the market itself, and I've paid the tuition on that lesson more than once. The best swing trading strategies that work 2026 are adaptive; they don't blindly follow almanacs. They follow price. My strategy is simple: buy the dip at key support, add to the winner on the breakout, and don't try to be a hero shorting a freight train.
I'm not currently in a position, but I'm stalking an entry. I'm looking for a long on a dip into the $512 area, with a tight stop just below $509.50. My first target would be a retest of the $518 highs. If we get a strong breakout, I'll trail my stop and aim for $525. That's a clean 3:1 risk/reward setup, and it's based on what the chart is doing today, not in March of 1998.
What makes me wrong? The thesis gets nuked if we get a daily close below $505. A close below that major demand zone would tell me the character of the market has changed. It would mean the bears have finally taken control, the seasonal stats were just early, and it's time to get flat or even look for shorts on a retest.
Seasonality tells you where the road *usually* is. Price action tells you where the car is *right now*. Don't drive off a cliff staring at an old map.
The bottom line is that historical data is a useful guide, but it's not a trading signal. The price is the only signal that matters. Everyone sees the same historical stats, but the tape doesn't lie. So are you trading the ghost of markets past, or the price action right in front of your face?