
📣 Create Blog for Traders!
Stop Watching news - Start Making it.
START


SP500 'Trump-Dive' Is a Trap: My Levels to Buy the Dip
The market is puking on Iran war drums, but the charts are telling a completely different story. Here's why I'm looking to buy this fear.
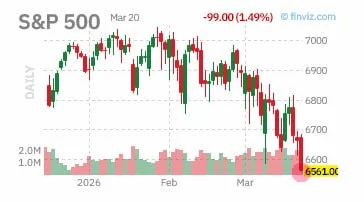
Is this Friday's sell-off the start of the next big market crash? Every headline is screaming war, recession, and $200 oil. They're calling it the 'Trump-dive'. My answer? Not a chance. This is a classic, headline-driven shakeout designed to panic retail out of their positions. And I'm looking for a spot to buy it.
Headlines create fear. Fear creates opportunity. This 'Trump-dive' looks like a classic shakeout designed to steal shares from weak hands before the next leg up.
Let's be real, the news sounds terrifying. Reports of a potential US ground operation in Iran hit the tape this morning and the algos went haywire. The S&P 500 futures ($ES_F) dumped nearly 1.5% in an hour. While guys like Alex Volkov are probably deep-diving the geopolitical chess match, I keep it simple: what is the chart telling me?
And the chart is telling me this isn't institutional, long-term selling. This is a flush. We wicked right down to a key high-volume node from February around the 4950 level on $ES_F and immediately found buyers. The volume was high, but it wasn't capitulation. It looked more like a cascade of stop losses getting triggered than a genuine regime change in market structure. The market has been pricing in geopolitical tension for months; this is just the latest chapter.
For anyone looking for the best day trading setups today, it's all about the levels. The key support for S&P 500 futures ($ES_F) is the 4950-4960 zone, a major volume shelf from last month. Critical resistance is the breakdown point from this morning's news, right around 5015. A firm reclaim of 5015 on the 1-hour chart would tell me the fear has subsided and the uptrend wants to resume.
- Major Support: 4950 (High Volume Node)
- Secondary Support: 4920 (21-Day EMA)
- Key Resistance: 5015 (Pre-news breakdown level)
- My Invalidation: A daily close below 4920.
Also, watch the VIX. It spiked to 19.5 but couldn't even break 20 and is already fading. On news this big, a weak VIX spike is actually bullish. It shows the 'smart money' isn't rushing to buy protection. They're either holding or buying the dip themselves.
So how do I play this? I'm not just blindly mashing the buy button at support. I need to see confirmation. I use simple technical analysis chart patterns to find my entry. My favorite setup is the breakout retest, and I'm watching the 15-minute chart for it.
I took a small starter long at 4955 with a tight stop below the session low at 4944. It's a feeler position. My real entry will be if we can reclaim the 4980 level and then successfully retest it as support. If that holds, I'll add to my position, targeting a move back to the 5015 resistance for a nearly 3:1 reward/risk trade. This is a textbook example of buying fear when the technical structure remains intact.
This is pure price action. While Marcus Cole might be looking at Bitcoin flows and calling this a macro risk-off event, I believe indices are a different beast. For the S&P, the order book and the levels are king. Price pays.
Look, I could be dead wrong. A full-scale ground war is a massive unknown, and if oil truly starts ripping toward $200, my bullish thesis is toast. A daily close below the 21 EMA at 4920 would invalidate the setup, and I'd be flat and back to cash. That's why we use stops. No ego.
The biggest danger for me now is getting chopped up. If my first entry gets stopped out, the temptation to revenge trade will be huge. I've learned that lesson the hard way, blowing up two accounts before it finally stuck. One good setup, one clean entry. That's the mantra today.
Am I being a gunslinger for wanting to buy this fear, or is the market massively overplaying its hand on the Iran news? Let me know what your charts are telling you.