
📣 Create Blog for Traders!
Stop Watching news - Start Making it.
START


Long-Only Funds Dump Stocks: A Capitulation or a Trap?
A record $9.6 billion in US stocks was sold by long-only funds last week. Here's what my charts are telling me about this historic move.
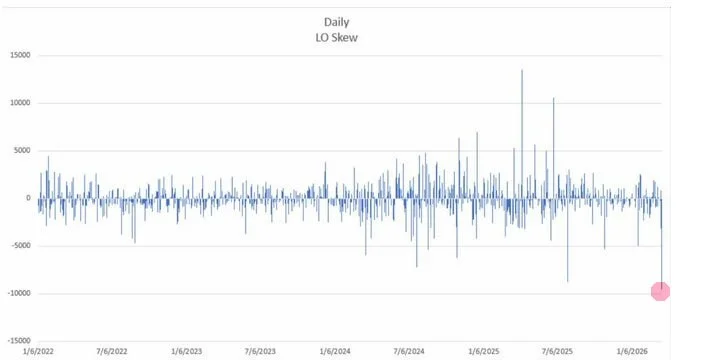
Last time I saw this kind of forced, indiscriminate selling was the COVID dump in March 2020. Sheer panic. So when Goldman's desk reports that long-only funds sold a record $9.6 billion in US stocks last Thursday, my ears perk up. This isn't just hedge funds flipping positions for a quick buck. This is the 'smart money', the big pension and mutual funds, hitting the eject button. And it changes the game heading into this week.
While Sarah Chen is probably dissecting the fundamental reasons for the exodus, I'm focused on one thing: the tape. Price and volume. This kind of move is either capitulation—the final puke-out before a massive reversal—or it's the opening act for a much bigger nuke. My money is on the former, but I'm not placing any bets until the chart gives me the green light.
Let's be clear: long-only funds are the slowest ships in the ocean. They don't just sell. When they do, it's either because of massive client redemptions or a seismic shift in their outlook. This isn't just a technical breakdown; it's a fundamental capitulation. We saw the VIX spike to 35 on Thursday but it couldn't hold, closing back below 30. That's a sign of indecision.
This kind of volatility is a goldmine for day traders. It creates huge liquidity gaps and emotional moves. These are the conditions that create some of the best day trading setups today if you know how to spot them. You have to be nimble, but the reward can be huge.
This record selling by long-only funds could be a classic bear trap. Capitulation by 'strong hands' often marks a short-term bottom before a sharp relief rally. However, if buyers don't step in to absorb the supply above key support levels (like SPX 4,850), it signals genuine panic and the start of a much deeper correction. Price action this week will reveal the truth.
I'm not just blindly buying this dip. That's how you blow up an account. I'm looking for a specific sequence: a failed breakdown below a key level, followed by a powerful reclaim. My favorite breakout trading strategy is to wait for confirmation, then trade the retest. Patience pays, especially when everyone else is panicking. As Alex Volkov would say, the derivatives market is probably pricing in chaos, which can fuel a squeeze.
- Key Support Zone: 4,850. If this level breaks and holds below, my next target is 4,780.
- Major Resistance: 4,925. This was the breakdown point. A reclaim on heavy volume flips me bullish.
- The Chop Zone: Anything between 4,850 and 4,900 is a knife fight. I'm staying out until we get a clean break.
I'll be honest, I got chopped up a bit on Friday trying to long a dip that just kept dipping. It was a frustrating session, and I had to fight the urge to revenge trade. This Goldman note provides clarity. It wasn't random noise; it was a historic liquidation event. It doesn't mean we automatically bounce, but it defines the battlefield for this week.
When the 'smart money' is forced to sell, it's not smart anymore—it's just forced. That's where the opportunity is.
My core thesis is that this is exhaustion selling, and we're closer to a tradable bottom than a full-on crash. But I trade the chart in front of me, not the story I want to be true. If we lose last week's lows with conviction, I'll happily get short and ride it down. No ego in this game.
So, is this the final flush that sets up the next big leg higher, or are you looking at your portfolio and getting ready to join the sellers?