
📣 Create Blog for Traders!
Stop Watching news - Start Making it.
START


Stocks Rip on Trump News: A Bull Trap I'm Fading 2026
The market is popping on geopolitical headlines, but the charts are telling me this is a classic fakeout. Here's why I'm looking to short this rally.
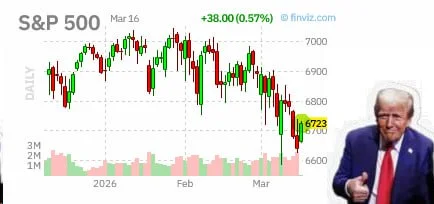
I got absolutely chopped to pieces last week trying to trade the oil headlines. Every time I thought I had a read, some new development would nuke my position. It was a good, hard lesson in my Achilles heel: over-trading the news. So when I saw the S&P 500 (SPX) ripping this morning on Trump's calls for NATO to get more involved with Iran, my first thought wasn't 'buy'. It was 'show me the chart'.
Look, price is all you need. The market is using this news as an excuse to bounce off a key support level, but the overall structure hasn't changed one bit. This is where you need to ignore the noise and focus on the real support and resistance levels today. This pop looks juicy, but it's running straight into a wall of sellers.
Let's pull up the SPX 4-hour chart. We saw a nasty drop from the 5520 highs last week, and we found some buyers around the 5380 level. Today's rally? It's just a retest of the breakdown area. What's more important is the volume. My volume price analysis trading approach is screaming 'caution' right now. The volume on this green candle is pathetic compared to the red candles that brought us down here. That's a huge red flag. It tells me there's no real conviction behind this move.
This reminds me of what Marcus Cole wrote about Bitcoin ignoring geopolitical jitters. The underlying technical structure is what matters most. For SPX, that structure is looking heavy.
Absolutely not. Chasing a low-volume, news-driven rip into overhead resistance is how you blow up an account. The best setup is waiting for this rally to fail. I'm stalking a short entry, not chasing this green candle. Patience pays, especially on a Monday morning when the market is just digesting weekend headlines.
- Entry Zone (Short): Looking for weakness between $5445 - $5460.
- Stop Loss: A firm daily close above $5480 invalidates the idea.
- Profit Target 1: Back down to today's support at $5390.
- Risk/Reward: Approximately 3:1 on the initial target.
While fundamental analysts like Sarah Chen are probably digging into the long-term sector implications of this geopolitical shift, my job is to trade the price in front of me. And the price is telling me this rally is on shaky ground.
Headlines make you feel smart, but levels make you money. I'm fading this rip until the chart proves me wrong.
I'm staying nimble. If we see a huge surge of volume and a clean break above my stop loss level, I'll gladly admit I was wrong and flip my bias. But for now, I'm a seller into strength. Am I being too cynical, or is this the most obvious bull trap we've seen all month?